"Algorithmic trading, also called automated trading, black-box trading, or algo trading, is the use of electronic platforms for entering trading orders with an algorithm which executes pre-programmed trading instructions whose variables may include timing, price, or quantity of the order, or in many cases initiating the order by a "robot", without human intervention. Algorithmic trading is widely used by investment banks, pension funds, mutual funds, and other buy-side (investor-driven) institutional traders, to divide large trades into several smaller trades to manage market impact and risk. Sell side traders, such as market makers and some hedge funds, provide liquidity to the market, generating and executing orders automatically.
A special class of algorithmic trading is "high-frequency trading" (HFT), which is often most profitable during periods of high market volatility. During the past years, companies such as Algorates have employed HFT strategies, recording high profits even during periods in which the markets have seen steep declines." [Algorithmic trading. Wikipedia]
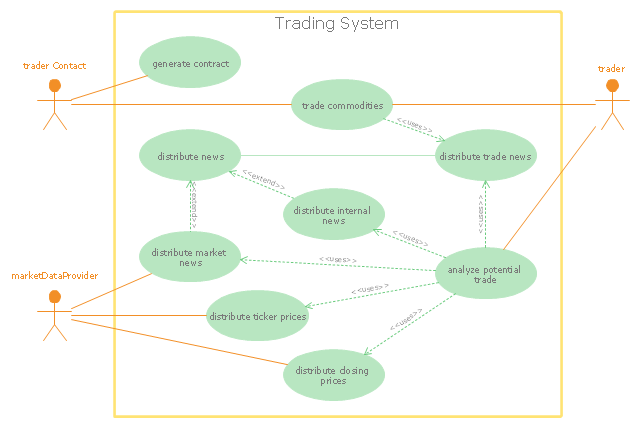
The UML use case diagram example "Trading system usage scenarios" was created using the ConceptDraw PRO diagramming and vector drawing software extended with the Rapid UML solution from the Software Development area of ConceptDraw Solution Park.
A special class of algorithmic trading is "high-frequency trading" (HFT), which is often most profitable during periods of high market volatility. During the past years, companies such as Algorates have employed HFT strategies, recording high profits even during periods in which the markets have seen steep declines." [Algorithmic trading. Wikipedia]
The UML use case diagram example "Trading system usage scenarios" was created using the ConceptDraw PRO diagramming and vector drawing software extended with the Rapid UML solution from the Software Development area of ConceptDraw Solution Park.
UML use case diagram
UML Use Case Diagram Example. Social Networking Sites Project

This sample shows the Facebook Socio-health system and is used at the projection and creating of the social networking sites.
Bar Diagrams for Problem Solving. Create event management bar charts with Bar Graphs Solution

 Rapid UML
Rapid UML solution extends ConceptDraw DIAGRAM software with templates, samples and libraries of vector stencils for quick drawing the UML diagrams using Rapid Draw technology.
Introduction to Cloud Computing Architecture

Flowchart on Bank. Flowchart Examples

This sample shows the Flowchart of the Subprime Mortgage Crisis. This Flowchart describes the decline in housing prices when the housing bubble burst and what it caused on the housing and financial markets. You can also see the Government and Industry responses in this crisis situation.

Workflow Diagram Data

ConceptDraw DIAGRAM is a workflow diagram software contains specific features help you to draw diagrams faster, such as RapidDraw, or Arrows10. There is also a rich set of samples and templates to give you an example of data may be visualized as workflow diagram.
Flowchart Software

ConceptDraw DIAGRAM flowchart software will help to quickly create new flowcharts, workflow, NS Diagram, BPMN Diagram, Cross-functional flowcharts, data flow diagrams and highlight flowcharts.
Feature-rich flowchart maker, free thousand flowchart examples and templates and colored symbols that will allow you to create professional looking flowcharts simply.
ConceptDraw DIAGRAM supports macOS and Windows.

 Business Process Diagrams
Business Process Diagrams solution extends the ConceptDraw DIAGRAM BPM software with RapidDraw interface, templates, samples and numerous libraries based on the BPMN 1.2 and BPMN 2.0 standards, which give you the possibility to visualize equally easy simple and complex processes, to design business models, to quickly develop and document in details any business processes on the stages of project’s planning and implementation.
BPR Diagram. Business Process Reengineering Example

Flowchart Examples and Templates

Workflow Flowchart Symbols

Bar Diagrams for Problem Solving. Create manufacturing and economics bar charts with Bar Graphs Solution

- Use Case Diagram Example For Investment
- UML Use Case Diagram Example Social Networking Sites Project ...
- Flowchart on Bank. Flowchart Examples | UML Use Case Diagram ...
- UML Use Case Diagram Example Social Networking Sites Project ...
- UML for Bank
- UML Use Case Diagram Example Registration System
- Bank ATM use case diagram | UML Use Case Diagram Example ...
- UML Use Case Diagram Example Social Networking Sites Project ...
- UML Use Case Diagram Example Social Networking Sites Project ...
- UML Use Case Diagram Example Social Networking Sites Project ...
- UML use case diagram - Trading system usage scenarios | UML use ...
- Use Case Diagrams For Investment Banking
- Flowchart on Bank. Flowchart Examples | Cross-Functional ...
- Flowchart on Bank. Flowchart Examples | Investment System For ...
- Interaction between market actors | Venn Diagrams | UML use case ...
- UML use case diagram - Banking system | How to Create a Bank ...
- UML use case diagram - Trading system usage scenarios | Mutual ...
- UML use case diagram - Trading system usage scenarios | UML ...
- UML Tool & UML Diagram Examples | UML use case diagram ...
- UML use case diagram - Trading system usage scenarios ...
- ERD | Entity Relationship Diagrams, ERD Software for Mac and Win
- Flowchart | Basic Flowchart Symbols and Meaning
- Flowchart | Flowchart Design - Symbols, Shapes, Stencils and Icons
- Flowchart | Flow Chart Symbols
- Electrical | Electrical Drawing - Wiring and Circuits Schematics
- Flowchart | Common Flowchart Symbols
- Flowchart | Common Flowchart Symbols