The vector stencils library "Resources and energy" contains 19 clipart images for drawing illustrations on resources and energy.
"Natural resources occur naturally within environments that exist relatively undisturbed by humanity, in a natural form. A natural resource is often characterized by amounts of biodiversity and geodiversity existent in various ecosystems.
Natural resources are derived from the environment. Some of them are essential for our survival while most are used for satisfying our wants. Natural resources may be further classified in different ways.
Natural resources are materials and components (something that can be used) that can be found within the environment. Every man-made product is composed of natural resources (at its fundamental level). A natural resource may exist as a separate entity such as fresh water, and air, as well as a living organism such as a fish, or it may exist in an alternate form which must be processed to obtain the resource such as metal ores, oil, and most forms of energy." [Natural resource. Wikipedia]
The clip art example "Resources and energy - Vector stencils library" was created in ConceptDraw PRO diagramming and vector drawing software using the Manufacturing and Maintenance solution from the Illustration area of ConceptDraw Solution Park.
Human resources

Batteries

Wind turbine

Transmission tower

Natural gas burner

Solar panel

Lightning

Ionizing radiation hazard sign

High voltage symbol

Atom

Incandescent light bulb

Oil barrels

Power station

Wood

Perpetuum mobile

Hydroelectric dam

Liquefied petroleum gas

Natural gas

Minecart with coal

The vector stencils library "Chemical elements" contains 118 icon symbols of chemical elements for drawing atoms, structural formulas and ball-and-stick models of inorganic and organic molecules and ions, and schemes of chemical reaction mechanisms.
"In chemistry, the ball-and-stick model is a molecular model of a chemical substance which is to display both the three-dimensional position of the atoms and the bonds between them. The atoms are typically represented by spheres, connected by rods which represent the bonds. Double and triple bonds are usually represented by two or three curved rods, respectively. In a good model, the angles between the rods should be the same as the angles between the bonds, and the distances between the centers of the spheres should be proportional to the distances between the corresponding atomic nuclei. The chemical element of each atom is often indicated by the sphere's color." [Ball-and-stick model. Wikipedia]
The chemical symbols example "Design elements - Chemical elements" was created using the ConceptDraw PRO software extended with the Chemistry solution from the Science and Education area of ConceptDraw Solution Park.
Chemical element icons
The vector stencils library "Periodic table of chemical elements" contains 119 icon symbols of chemical elements for drawing Mendeleev's periodic table, chemical diagrams, infographics and illustrations.
"A chemical element is a pure chemical substance consisting of a single type of atom distinguished by its atomic number, which is the number of protons in its atomic nucleus. Elements are divided into metals, metalloids, and non-metals. Familiar examples of elements are carbon, nitrogen, oxygen (non-metals), silicon, arsenic (metalloids), aluminium, iron, copper, gold, mercury, and lead (metals).
The lightest chemical elements, including hydrogen, helium and smaller amounts of lithium, beryllium and boron, are thought to have been produced by various cosmic processes during the Big Bang and cosmic-ray spallation. Production of heavier elements, from carbon to the very heaviest elements, proceeded by stellar nucleosynthesis, and these were made available for later solar system and planetary formation by planetary nebulae and supernovae, which blast these elements into space. The high abundance of oxygen, silicon, and iron on Earth reflects their common production in such stars. While most elements are generally stable, a small amount of natural transformation of one element to another also occurs in the decay of radioactive elements as well as other natural nuclear processes." [Chemical element. Wikipedia]
The chemical symbols example "Design elements - Periodic table of chemical elements" was created using the ConceptDraw PRO software extended with the Chemistry solution from the Science and Education area of ConceptDraw Solution Park.
Mendeleev periodic table icons
This work flow chart sample was redesigned from the picture "Simulation for earthquake disaster assessment" from the article "Simulation Workflows".
[iaas.uni-stuttgart.de/ forschung/ projects/ simtech/ sim-workflows.php]
" This simulation was developed to have an in depth understanding of the destructions and the decisions to be made in various phases of crisis management (Source: Mahdi Hashemi and Ali A. Alesheikh (2010). "Developing an agent based simulation model for earthquakes in the context of SDI." GSDI 12 World Conference. 19 – 22 October 2010. Singapour). The simulation process contains following major steps:
(1) All spatial information including satellite images (before and after the earthquake) and topographic/ cadastral maps of the area are mosaicked and georeferenced. The parts of the city that contain various levels of destructions are selected. Three types of features namely buildings, roads and recreational areas are classified and extracted from the satellite images.
(2) The governing factors of destructions are identified; a mathematical model that integrates the factors is constructed.
(3) The simulation is constructed for various parameter values (different earthquake strength, time elapses, etc.)" [iaas.uni-stuttgart.de/ forschung/ projects/ simtech/ sim-workflows.php]
The example "Workflow diagram - Earthquake disaster assessment" was drawn using the ConceptDraw PRO diagramming and vector drawing software extended with the Workflow Diagrams solution from the Business Processes area of ConceptDraw Solution Park.
Work flow chart

"Consumption of energy resources, (e.g. turning on a light) requires resources and has an effect on the environment. Many electric power plants burn coal, oil or natural gas in order to generate electricity for energy needs. While burning these fossil fuels produces a readily available and instantaneous supply of electricity, it also generates air pollutants including carbon dioxide (CO2), sulfur dioxide and trioxide (SOx) and nitrogen oxides (NOx). Carbon dioxide is an important greenhouse gas which is thought to be responsible for some fraction of the rapid increase in global warming seen especially in the temperature records in the 20th century, as compared with tens of thousands of years worth of temperature records which can be read from ice cores taken in Arctic regions. Burning fossil fuels for electricity generation also releases trace metals such as beryllium, cadmium, chromium, copper, manganese, mercury, nickel, and silver into the environment, which also act as pollutants.
The large-scale use of renewable energy technologies would "greatly mitigate or eliminate a wide range of environmental and human health impacts of energy use". Renewable energy technologies include biofuels, solar heating and cooling, hydroelectric power, solar power, and wind power. Energy conservation and the efficient use of energy would also help." [Energy industry. Environmental impact. Wikipedia]
The Energy resources diagram example was created in the ConceptDraw PRO diagramming and vector drawing software using the Manufacturing and Maintenance solution from the Illustration area of ConceptDraw Solution Park.
Infographics

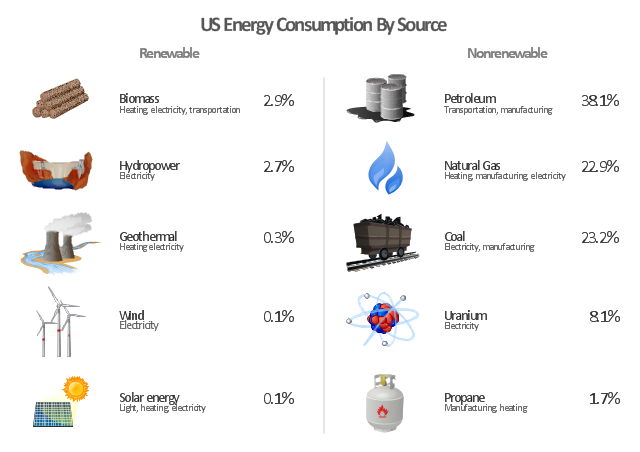
"The United States is the 800th largest energy consumer in terms of total use in 2010. ...
The majority of this energy is derived from fossil fuels: in 2010, data showed 25% of the nation's energy came from petroleum, 22% from coal, and 22% from natural gas. Nuclear power supplied 8.4% and renewable energy supplied 8%, which was mainly from hydroelectric dams although other renewables are included such as wind power, geothermal and solar energy." [Energy in the United States. Wikipedia]
The infographics example "U.S. energy consumption by source" was created in the ConceptDraw PRO diagramming and vector drawing software using the Manufacturing and Maintenance solution from the Illustration area of ConceptDraw Solution Park.
Infographics
This work flow chart sample was redesigned from the picture "Weather Forecast" from the article "Simulation Workflows".
[iaas.uni-stuttgart.de/ forschung/ projects/ simtech/ sim-workflows.php]
"(1) The weather is predicted for a particular geological area. Hence, the workflow is fed with a model of the geophysical environment of ground, air and water for a requested area.
(2) Over a specified period of time (e.g. 6 hours) several different variables are measured and observed. Ground stations, ships, airplanes, weather balloons, satellites and buoys measure the air pressure, air/ water temperature, wind velocity, air humidity, vertical temperature profiles, cloud velocity, rain fall, and more.
(3) This data needs to be collected from the different sources and stored for later access.
(4) The collected data is analyzed and transformed into a common format (e.g. Fahrenheit to Celsius scale). The normalized values are used to create the current state of the atmosphere.
(5) Then, a numerical weather forecast is made based on mathematical-physical models (e.g. GFS - Global Forecast System, UKMO - United Kingdom MOdel, GME - global model of Deutscher Wetterdienst). The environmental area needs to be discretized beforehand using grid cells. The physical parameters measured in Step 2 are exposed in 3D space as timely function. This leads to a system of partial differential equations reflecting the physical relations that is solved numerically.
(6) The results of the numerical models are complemented with a statistical interpretation (e.g. with MOS - Model-Output-Statistics). That means the forecast result of the numerical models is compared to statistical weather data. Known forecast failures are corrected.
(7) The numerical post-processing is done with DMO (Direct Model Output): the numerical results are interpolated for specific geological locations.
(8) Additionally, a statistical post-processing step removes failures of measuring devices (e.g. using KALMAN filters).
(9) The statistical interpretation and the numerical results are then observed and interpreted by meteorologists based on their subjective experiences.
(10) Finally, the weather forecast is visualized and presented to interested people." [iaas.uni-stuttgart.de/ forschung/ projects/ simtech/ sim-workflows.php]
The example "Workflow diagram - Weather forecast" was drawn using the ConceptDraw PRO diagramming and vector drawing software extended with the Workflow Diagrams solution from the Business Processes area of ConceptDraw Solution Park.
Work flow chart

- Resources and energy - Vector stencils library | Design elements ...
- 2007 World uranium mining | Pie Graph | Chemical elements ...
- Resources and energy - Vector stencils library | Molecule Atom ...
- 2007 World uranium mining | Pie Charts | Picture graphs - Vector ...
- Resources and energy - Vector stencils library | Resources and ...
- Uranium Energy Diagram
- Resources and energy - Vector stencils library | Resources and ...
- Resources and energy - Vector stencils library | Computers and ...
- Resources and energy - Vector stencils library | Energy resources ...
- Resources and energy - Vector stencils library | Life cycle analysis ...
- Design elements - Stations | Electrical Symbols — Stations | 2007 ...
- Energy Pyramid Diagram | Resources and energy - Vector stencils ...
- Electrical Symbols — Stations | Design elements - Stations ...
- Vector stencils library
- Electrical Symbols — Power Sources | Resources and energy ...
- Resources and energy - Vector stencils library | Geo Map - USA ...
- Resources and energy - Vector stencils library | LLNL Flow Charts ...
- Resources and energy - Vector stencils library | Ecology pictograms ...
- Atomic Element Vector Design
- Resources and energy - Vector stencils library | Design elements ...
- ERD | Entity Relationship Diagrams, ERD Software for Mac and Win
- Flowchart | Basic Flowchart Symbols and Meaning
- Flowchart | Flowchart Design - Symbols, Shapes, Stencils and Icons
- Flowchart | Flow Chart Symbols
- Electrical | Electrical Drawing - Wiring and Circuits Schematics
- Flowchart | Common Flowchart Symbols
- Flowchart | Common Flowchart Symbols