HelpDesk
How to Create a Fault Tree Analysis Diagram (FTD) in ConceptDraw PRO

This healthcare economics infogram example was redesigned from the Wikimedia Commons file: Medicare spending per capita.png.
"Research by The Dartmouth Institute for Health Policy and Clinical Practice in the Dartmouth Atlas showed that in 2006, Medicare spending varied significantly by state. Other research quoted by the CEA Report indicated that up to 30% of Medicare costs could be saved if the middle- and high-cost states spent at the level of the lower-cost states.[1] Bear in mind that this is a Medicare comparison, so all the persons in the population analyzed are over 65.
References:
1. White House Council of Economic Advisors (CEA)-The Economic Case for Health Care Reform-June 2009-Page 19."
[commons.wikimedia.org/ wiki/ File:Medicare_ spending_ per_ capita.png]
The healthcare management thematic map sample "U.S. Medicare spending per capita" was created using the ConceptDraw PRO diagramming and vector drawing software extended with the Management Infographics solition from the area "Business Infographics" in ConceptDraw Solution Park.
Healthcare management infographics example

 Audio and Video Connectors
Audio and video connectors solution extends ConceptDraw PRO software with templates, samples and library of vector stencils for drawing audio and video hook up diagrams.
HelpDesk
How to Create a BPMN Diagram Using ConceptDraw PRO

HelpDesk
How to Create a Business Process Diagram

 iPhone User Interface
iPhone User Interface solution extends ConceptDraw PRO v10 software with templates, samples and libraries with large quantity of vector stencils of graphical user interface elements, Apps icons, UI patterns for designing and prototyping of the iOS applic
HelpDesk
Software for Flowchart Diagrams

 Entity-Relationship Diagram (ERD)
Entity-Relationship Diagram (ERD) solution extends ConceptDraw PRO software with templates, samples and libraries of vector stencils from drawing the ER-diagrams by Chen's and crow’s foot notations.
HelpDesk
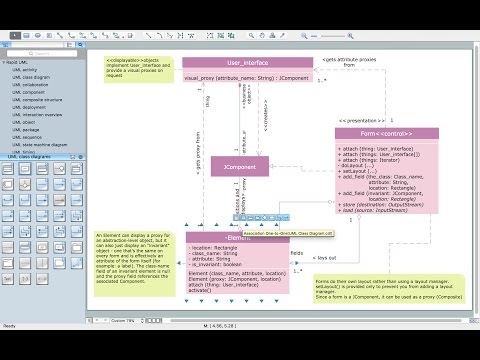
How to Create a UML Diagram Using ConceptDraw PRO

- HR arrows - Vector stencils library | Cruve Arrow Icon Png
- Curved Arrow Icon Png
- Angle Right Icon Png
- Up Arrow Png
- Up Arrow Clipart Png
- Arrow Up Icon Png
- Png Shapes Double Headed Arrow
- Curved Arrow Double Png
- Rotation Arrow Icon Png
- Arrow Png Yellow
- Upward Arrow Png
- Turn Arrow Png
- Yellow Arrows Down Png
- Icon Arrow Png
- Orange Curve Arrow Icon
- Refresh Icon White Png
- Rounded Arrow Png
- Arrow Down Icon Black Png
- Arrow Icon Up Down
- Icon Gray Png
- ERD | Entity Relationship Diagrams, ERD Software for Mac and Win
- Flowchart | Basic Flowchart Symbols and Meaning
- Flowchart | Flowchart Design - Symbols, Shapes, Stencils and Icons
- Flowchart | Flow Chart Symbols
- Electrical | Electrical Drawing - Wiring and Circuits Schematics
- Flowchart | Common Flowchart Symbols
- Flowchart | Common Flowchart Symbols