UML Class Diagram Notation

Entity Relationship Diagram Symbols

ERD symbols used for professional ERD drawing are collected in libraries from the Entity-Relationship Diagram (ERD) solution for ConceptDraw DIAGRAM.
UML Notation

Two types of diagrams are used in UML: Structure Diagrams and Behavior Diagrams. Behavior Diagrams represent the processes proceeding in a modeled environment. Structure Diagrams represent the elements that compose the system.
UML Class Diagram Generalization Example UML Diagrams

This sample describes the use of the classes, the generalization associations between them, the multiplicity of associations and constraints. Provided UML diagram is one of the examples set that are part of Rapid UML solution.
UML Component Diagram. Design Elements
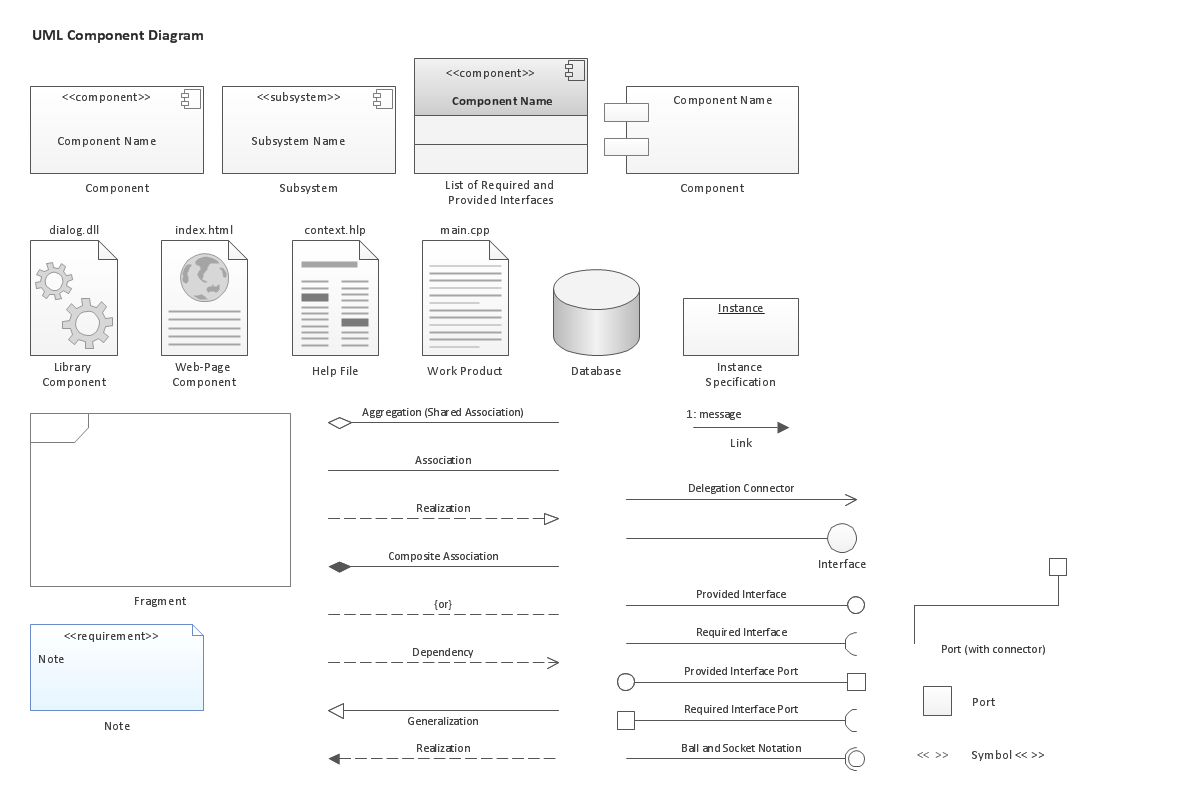
Rapid UML Solution for ConceptDraw DIAGRAM contains 13 vector stencils libraries with 393 interactive shapes that you can use to design your UML diagrams.
To design a Component Diagram use the UML Component Diagram library.
UML Component Diagram library contains 36 shapes

UML Diagram

Create unified modeling language (UML) diagrams with ConceptDraw.
Data modeling with ConceptDraw DIAGRAM

Database Flowchart Symbols

ConceptDraw Software provides number of data-base chart libraries including major 49 vector symbols. Use these DFD flowchart symbol libraries to design data-base structure and models, use it to design data base process-oriented models, or simple data-oriented models. The are special drawing tools for making data flowcharts, data process diagrams, structured analysis diagrams, and information flow diagrams.
Data Flow Diagrams

Data Flow Diagram

- Data modeling with ConceptDraw PRO | Uml Database Notation
- UML Class Diagram Notation | Design elements - ERD (crow's foot ...
- Uml Notation Database
- Entity-Relationship Diagram (ERD) | Data modeling with ...
- UML class diagram - Metadata information model | Data Flow ...
- ERD Symbols and Meanings | UML Notation | Data Dictionary For ...
- Database Symbol In Uml
- ConceptDraw PRO Database Modeling Software | Business Process ...
- Data structure diagram with ConceptDraw PRO | Data modeling with ...
- Business Process Modeling Notation Template | Databases Access ...
- ERD | Entity Relationship Diagrams, ERD Software for Mac and Win
- Flowchart | Basic Flowchart Symbols and Meaning
- Flowchart | Flowchart Design - Symbols, Shapes, Stencils and Icons
- Flowchart | Flow Chart Symbols
- Electrical | Electrical Drawing - Wiring and Circuits Schematics
- Flowchart | Common Flowchart Symbols
- Flowchart | Common Flowchart Symbols