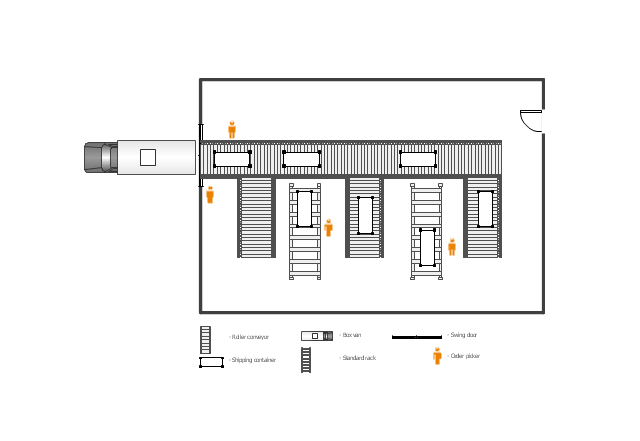
This floor plan example was drawn on the base of slide 27 "Warehouse Layout Floor Plan" of the presentation "Operations Management. Layout Strategy. Chapter 9" from the website of the School of Business Administration at Portland State University. [sba.pdx.edu/ faculty/ karlt/ Ch9/ sld027.htm]
"A conveyor system is a common piece of mechanical handling equipment that moves materials from one location to another. Conveyors are especially useful in applications involving the transportation of heavy or bulky materials. Conveyor systems allow quick and efficient transportation for a wide variety of materials, which make them very popular in the material handling and packaging industries. Many kinds of conveying systems are available, and are used according to the various needs of different industries. There are chain conveyors (floor and overhead) as well. Chain conveyors consist of enclosed tracks, I-Beam, towline, power & free, and hand pushed trolleys." [Conveyor system. Wikipedia]
The floor plan example "Warehouse with conveyor system" was created using the ConceptDraw PRO diagramming and vector drawing software extended with the Plant Layout Plans solution from the Building Plans area of ConceptDraw Solution Park.
Floor plan - Warehouse with conveyor system
Flow chart Example. Warehouse Flowchart

Standard warehousing process flow diagram and standard workflow diagram used for process identification for further evaluating effectiveness and profitability of overall business process. Use the ConceptDraw PRO diagramming and vector drawing software extended with the Flowcharts solution from the Diagrams area of ConceptDraw Solution Park to design your own workflow diagrams, process flow diagram and flow charts. Need to use Process Flow Diagram for designing Warehouse packages flow.

Emergency Plan


UML Class Diagram Tutorial

 Plant Layout Plans
This solution extends ConceptDraw PRO v.9.5 plant layout software (or later) with process plant layout and piping design samples, templates and libraries of vector stencils for drawing Plant Layout plans. Use it to develop plant layouts, power plant desig
Planogram

This example was created in ConceptDraw PRO diagramming and vector drawing software using the Basic Diagramming Solution from the Universal Diagramming area of ConceptDraw Solution Park.
Business Structure

TQM Diagram Example

EPC - Business Processes in Terms of Work Flows
")
The EPC diagram can shows various vayes how to reach positive company performance.
Activity Network (PERT) Chart

This diagram is constructed as part of the process in creating a schedule of corrective actions. The Activity Network Chart (PERT) shows the logical connections and consequence of tasks to be performed. It displays the time period for problem solving and the implementation of all activities through the critical path.
SWOT matrix template

Social Media Response Management DFD Charts - software tools


Process Engineering

How to Create Presentation of Your Project Gantt Chart

How To Create Onion Diagram

But how to create Onion Diagram? Now, it's very easy thanks to the ConceptDraw PRO diagramming and vector drawing software extended with Stakeholder Onion Diagrams Solution from the Management Area of ConceptDraw Solution Park.
- Typical Site Plan For A Warehouse
- Plan Of A Typical Warehouse
- Warehouse layout floor plan | Warehouse with conveyor system ...
- Flow chart Example. Warehouse Flowchart | 25 Typical Orgcharts ...
- Flow chart Example. Warehouse Flowchart | 25 Typical Orgcharts ...
- Warehouse Typical Floor Plan
- Organizational Structure | 25 Typical Orgcharts | How To Create ...
- Plant Layout Plans | Flow chart Example. Warehouse Flowchart ...
- Factory layout floor plan | Template Restaurant Floor Plan for Kids ...
- Flow chart Example. Warehouse Flowchart | Floor Plan Of A ...
- Organogram Software | PDPC | Flow chart Example. Warehouse ...
- Flow chart Example. Warehouse Flowchart | Plant Layout Plans ...
- Flow chart Example. Warehouse Flowchart | How To Create ...
- White Goods Warehouse Floor Plan
- Plant Layout Plans | Factory layout floor plan | Restaurant Floor ...
- Process Flowchart | Audit Steps | Flow chart Example. Warehouse ...
- Organogram Software | PDPC | Flow chart Example. Warehouse ...
- Production Planning Process Flowchart
- Plant Layout Plans | Emergency Plan | Warehouse with conveyor ...
- Sample Plan Of Warehouse Drawing
- ERD | Entity Relationship Diagrams, ERD Software for Mac and Win
- Flowchart | Basic Flowchart Symbols and Meaning
- Flowchart | Flowchart Design - Symbols, Shapes, Stencils and Icons
- Flowchart | Flow Chart Symbols
- Electrical | Electrical Drawing - Wiring and Circuits Schematics
- Flowchart | Common Flowchart Symbols
- Flowchart | Common Flowchart Symbols