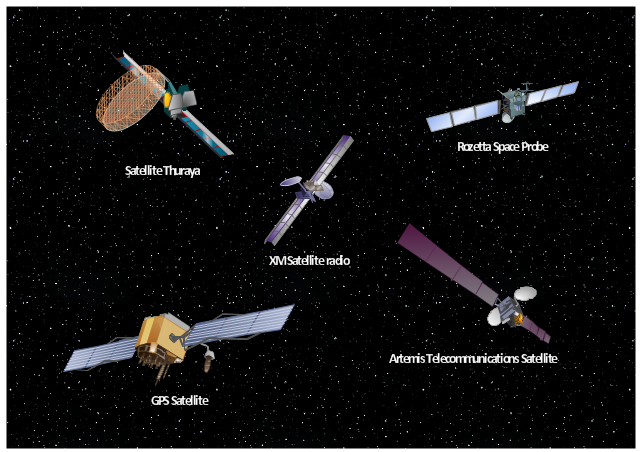
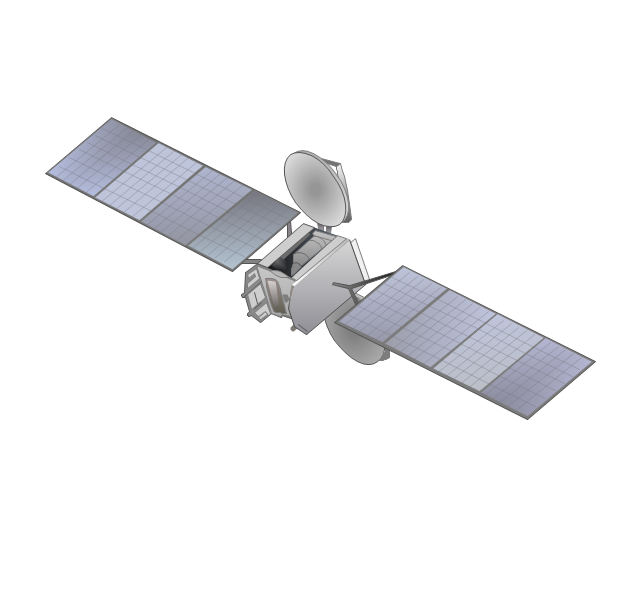
Use vector clipart library Aerospace to illustrate your documents, infographics, presentations and websites with images of satellites, space vehicles and objects using ConceptDraw PRO diagramming and vector drawing software.
"In the context of spaceflight, a satellite is an artificial object which has been intentionally placed into orbit.
Some satellites, notably space stations, have been launched in parts and assembled in orbit. A few hundred satellites are currently operational, whereas thousands of unused satellites and satellite fragments orbit the Earth as space debris. A few space probes have been placed into orbit around other bodies and become artificial satellites to the Moon, Mercury, Venus, Mars, Jupiter, Saturn, Vesta, Eros, and the Sun.
Common types include military and civilian Earth observation satellites, communications satellites, navigation satellites, weather satellites, and research satellites. Space stations and human spacecraft in orbit are also satellites. Satellite orbits ... include low Earth orbit, polar orbit, and geostationary orbit.
Satellites are propelled by rockets to their orbits.
Satellites are usually semi-independent computer-controlled systems. Satellite subsystems attend many tasks, such as power generation, thermal control, telemetry, attitude control and orbit control." [Satellite. Wikipedia]
The vector stencils library Aerospace is included in the Aerospace and Transport solution from Illustration area of ConceptDraw Solution Park.
Vector illustration
This wheel diagram sample was created on the base of figure illustrating the webpage "Chapter 3: Current State of the Ecosystem" of the website of the National Broadband Plan of US Federal Communications Comission (FCC). "The broadband ecosystem includes applications and content: e-mail, search, news, maps, sales and marketing applications used by businesses, user-generated video and hundreds of thousands of more specialized uses. Ultimately, the value of broadband is realized when it delivers useful applications and content to end-users.
Applications run on devices that attach to the network and allow users to communicate: computers, smartphones, set-top boxes, e-book readers, sensors, private branch exchanges (PBX), local area network routers, modems and an ever-growing list of other devices. New devices mean new opportunities for applications and content.
Finally, broadband networks can take multiple forms: wired or wireless, fixed or mobile, terrestrial or satellite. Different types of networks have different capabilities, benefits and costs.
The value of being connected to the network increases as more people and businesses choose to adopt broadband and use applications and devices that the network supports. Several factors contribute to their decisions. These include whether they can afford a connection, whether they are comfortable with digital technology and whether they believe broadband is useful.
Networks, devices and applications drive each other in a virtuous cycle. If networks are fast, reliable and widely available, companies produce more powerful, more capable devices to connect to those networks. These devices, in turn, encourage innovators and entrepreneurs to develop exciting applications and content. These new applications draw interest among end-users, bring new users online and increase use among those who already subscribe to broadband services. This growth in the broadband ecosystem reinforces the cycle, encouraging service providers to boost the speed, functionality and reach of their networks."
[broadband.gov/ plan/ 3-current-state-of-the-ecosystem/ ]
The circle pie chart example "Forces shaping the broadband ecosystem in the US" was created using the ConceptDraw PRO diagramming and vector drawing software extended with the Target and Circular Diagrams solution from the Marketing area of ConceptDraw Solution Park.
www.conceptdraw.com/ solution-park/ marketing-target-and-circular-diagrams
Wheel diagram

This work flow chart sample was redesigned from the picture "Simulation for earthquake disaster assessment" from the article "Simulation Workflows".
[iaas.uni-stuttgart.de/ forschung/ projects/ simtech/ sim-workflows.php]
" This simulation was developed to have an in depth understanding of the destructions and the decisions to be made in various phases of crisis management (Source: Mahdi Hashemi and Ali A. Alesheikh (2010). "Developing an agent based simulation model for earthquakes in the context of SDI." GSDI 12 World Conference. 19 – 22 October 2010. Singapour). The simulation process contains following major steps:
(1) All spatial information including satellite images (before and after the earthquake) and topographic/ cadastral maps of the area are mosaicked and georeferenced. The parts of the city that contain various levels of destructions are selected. Three types of features namely buildings, roads and recreational areas are classified and extracted from the satellite images.
(2) The governing factors of destructions are identified; a mathematical model that integrates the factors is constructed.
(3) The simulation is constructed for various parameter values (different earthquake strength, time elapses, etc.)" [iaas.uni-stuttgart.de/ forschung/ projects/ simtech/ sim-workflows.php]
The example "Workflow diagram - Earthquake disaster assessment" was drawn using the ConceptDraw PRO diagramming and vector drawing software extended with the Workflow Diagrams solution from the Business Processes area of ConceptDraw Solution Park.
Work flow chart

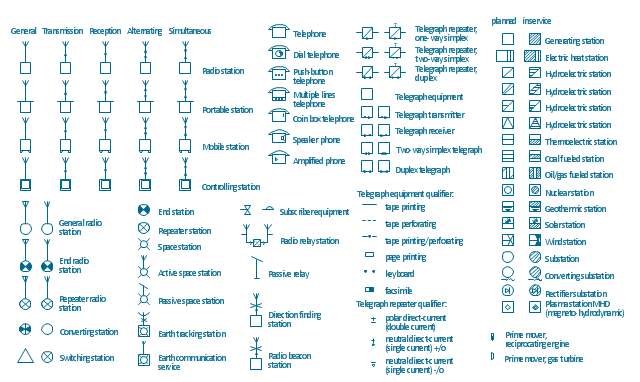
The vector stencils library "Stations" contains 110 symbols of communications equipment, generating, transmitting and receiving stations; substations; satellites; and power plants for power generation and distribution and radio relay systems.
"A power station (also referred to as a generating station, power plant, powerhouse or generating plant) is an industrial facility for the generation of electric power. At the center of nearly all power stations is a generator, a rotating machine that converts mechanical power into electrical power by creating relative motion between a magnetic field and a conductor. The energy source harnessed to turn the generator varies widely. It depends chiefly on which fuels are easily available, cheap enough and on the types of technology that the power company has access to. Most power stations in the world burn fossil fuels such as coal, oil, and natural gas to generate electricity, and some use nuclear power, but there is an increasing use of cleaner renewable sources such as solar, wind, wave and hydroelectric." [Power station. Wikipedia]
"Radio broadcasting is a one-way wireless transmission over radio waves intended to reach a wide audience. Stations can be linked in radio networks to broadcast a common radio format, either in broadcast syndication or simulcast or both. Audio broadcasting also can be done via cable radio, local wire television networks, satellite radio, and internet radio via streaming media on the Internet.
The signal types can be either analog audio or digital audio." [Radio broadcasting. Wikipedia]
The shapes example "Design elements - Stations" was drawn using the ConceptDraw PRO diagramming and vector drawing software extended with the Electrical Engineering solution from the Engineering area of ConceptDraw Solution Park.
Power and radio station symbols
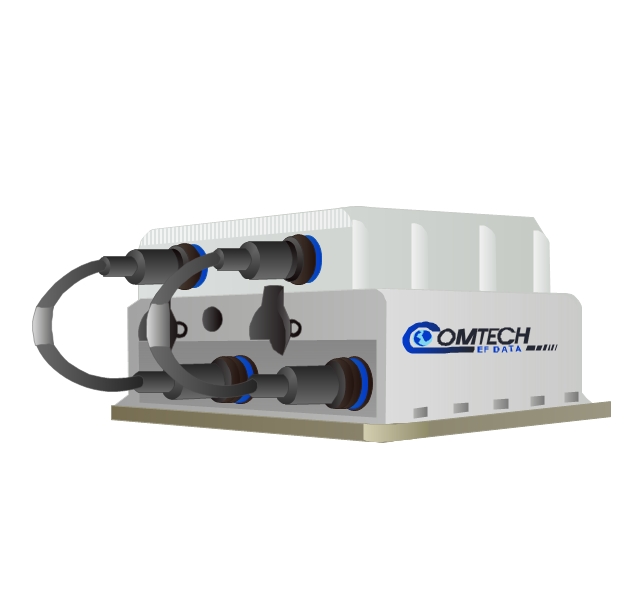
The vector stencils library "Comtech" contains 9 icons of Comtech devices for drawing computer network diagrams and telecommunication equipment layouts.
"Comtech EF Data Corporation ... communication solutions encompass Advanced VSAT Solutions, Modems, RAN & WAN Optimization, Network & Bandwidth Management, RF Products ... for fixed and mobile/ transportable satellite-based applications." [comtechefdata.com]
The clip art example "Comtech - Vector stencils library" was created using the ConceptDraw PRO diagramming and vector drawing software extended with the Telecommunication Network Diagrams solution from the Computer and Networks area of ConceptDraw Solution Park.
CDD-562L & CDD-562LEN dual IP demodulator
CDM-700G high-speed satellite modem
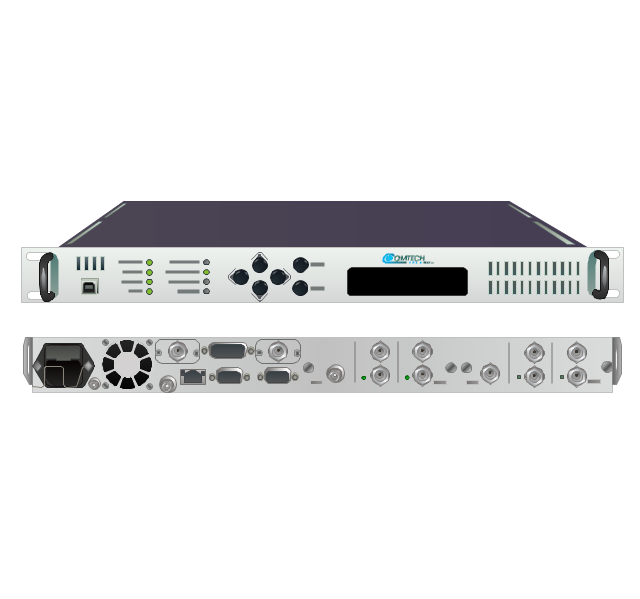
CDM-710G high-speed satellite modem
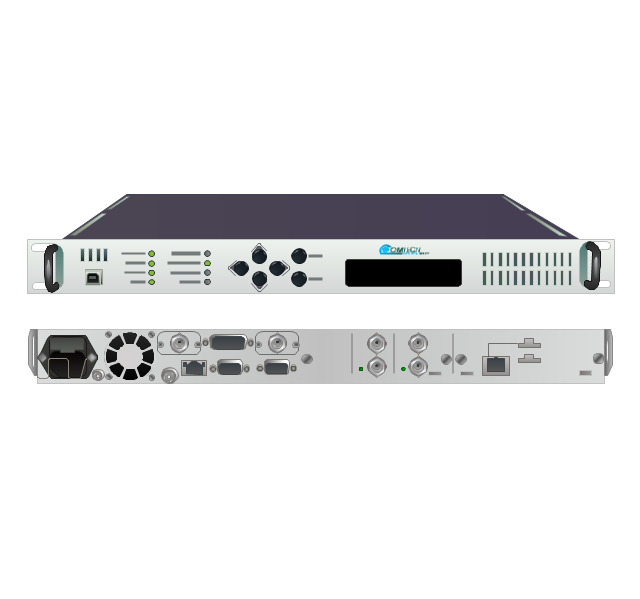
SLM-5650A satellite modem
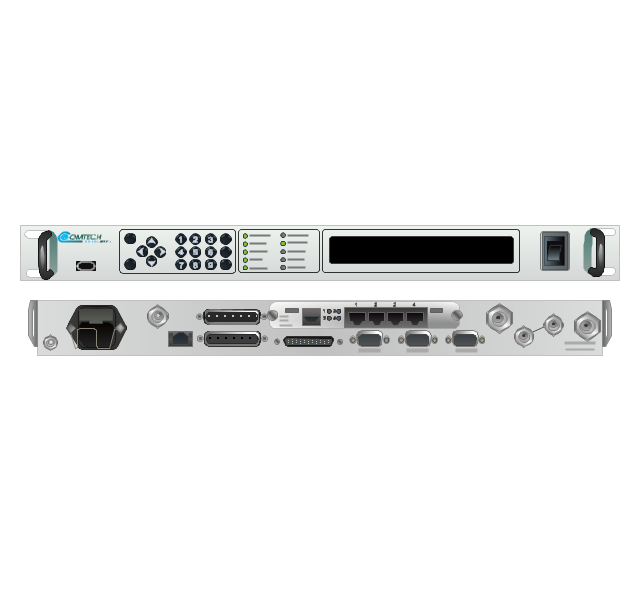
UT-4505 series up converters
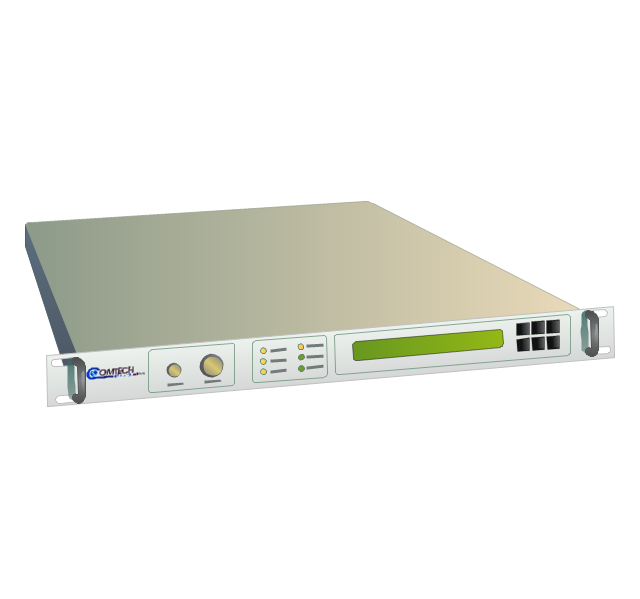
LPOD C- or Ku-band block up converters
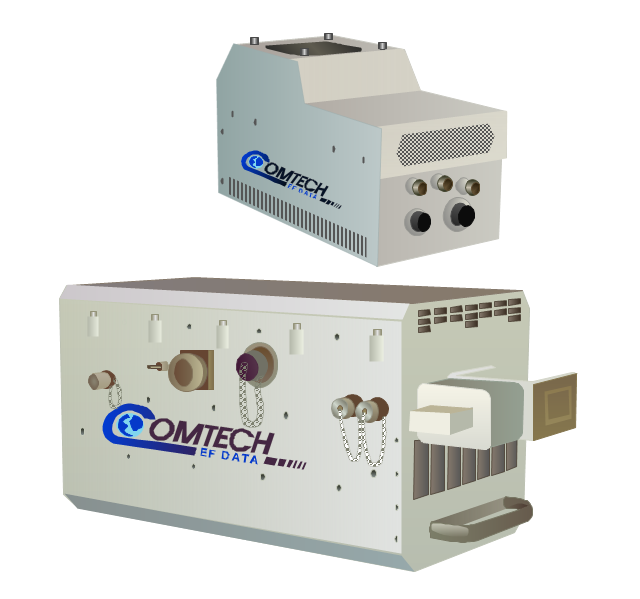
MBT-4000/ MBT-4000B outdoor multi-band RF transceiver
High-Power Outdoor C-, X- & Ku-band outdoor amplifier (HPOD)
-comtech---vector-stencils-library.png--diagram-flowchart-example.png)
Indoor solid state power amplifiers (SSPA)
-comtech---vector-stencils-library.png--diagram-flowchart-example.png)
 Wireless Networks
The Wireless Networks Solution extends ConceptDraw DIAGRAM software with professional diagramming tools, set of wireless network diagram templates and samples, comprehensive library of wireless communications and WLAN objects to help network engineers and designers efficiently design and create Wireless network diagrams that illustrate wireless networks of any speed and complexity, and help to identify all required equipment for construction and updating wireless networks, and calculating their costs.
The vector stencils library "Computer network" contains 51 symbols of computer network devices and equipment for drawing computer network diagrams.
"Network Mapping Software.
A number of software tools exist to design computer network diagrams / or generate visual maps of networks, servers, storage, services, data centers, and other peripherals. Broadly, there are two types of software tools - those that help create diagrams manually and those that generate them using automated / semi-automated approaches.
Type of Software.
(1) Manual - allows users to design and draw logical and physical topology diagrams by manually placing icons and connections.
(2) Automated - generate topology diagrams / maps by traversing the network and automatically discovering resident devices or by importing network data." [Comparison of network diagram software. Wikipedia]
ConceptDraw PRO is the software for manual design of computer network diagrams. The solutions of the Computer and Networks area in ConceptDraw Solution Park extend ConceptDraw PRO with vector stencils libraries, templates and examples for creating the computer network diagrams.
The symbols example "Computer network - Vector stencils library" was created using the ConceptDraw PRO diagramming and vector drawing software extended with the Computer and Networks solution from the Computer and Networks area of ConceptDraw Solution Park.
www.conceptdraw.com/ solution-park/ computer-and-networks
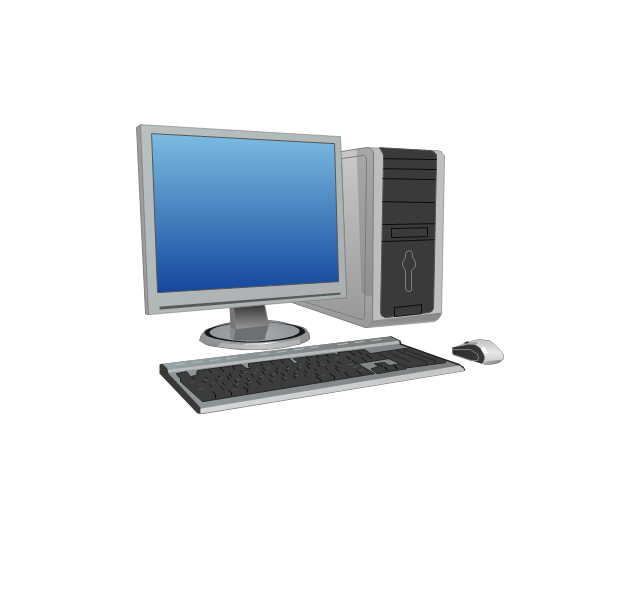
Laptop

Desktop computer
Firewall

Bus

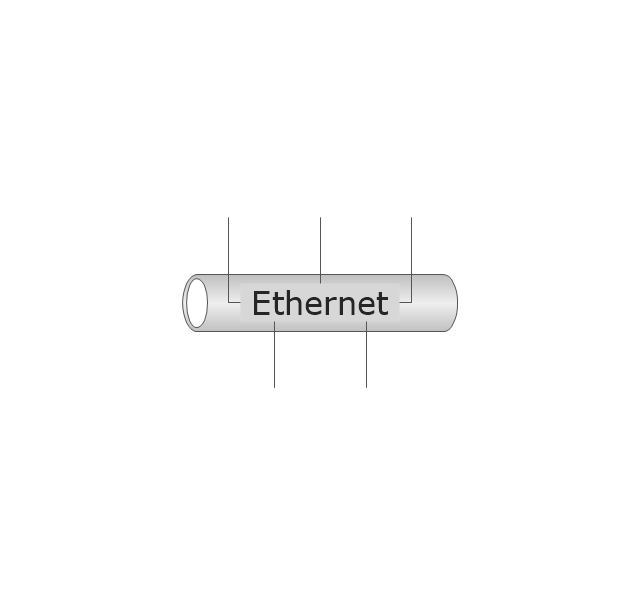
Ethernet
Star network

FDDI Ring

Token-ring

Comm-link

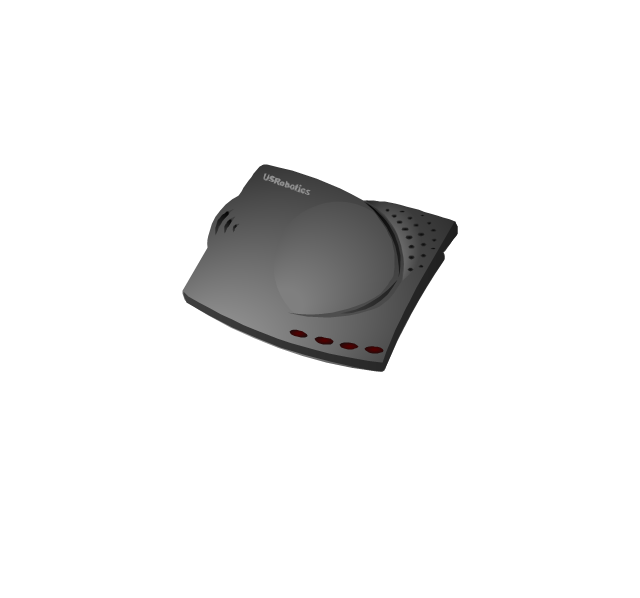
Modem
Laser printer

Inkjet printer
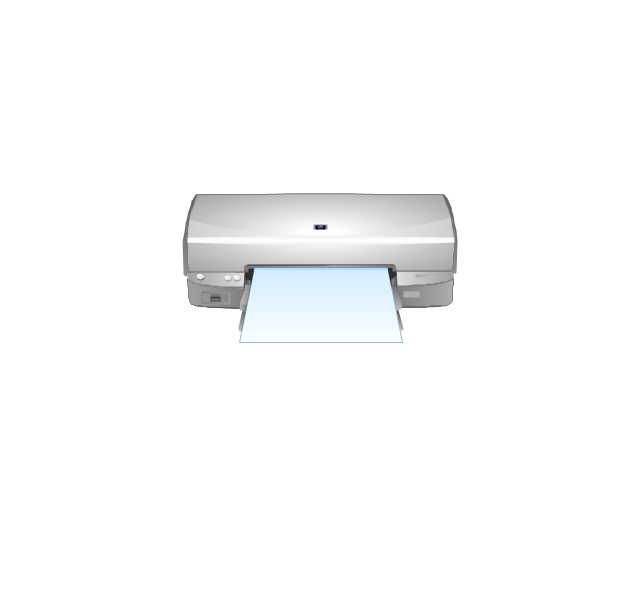
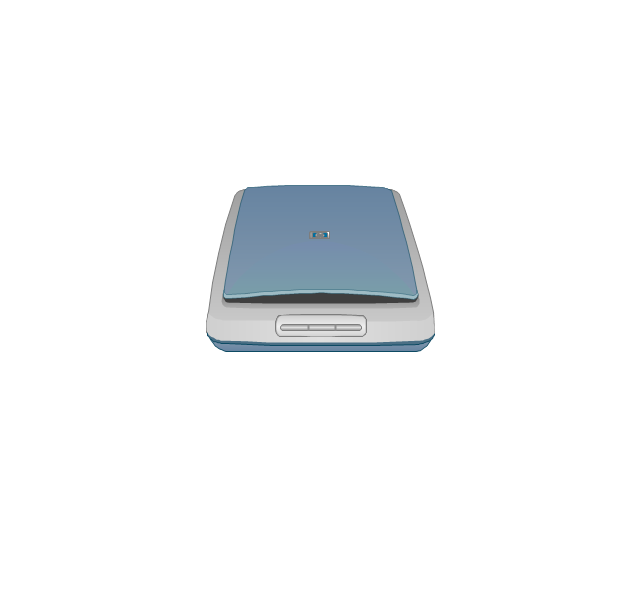
Image scanner
City

Ethernet hub
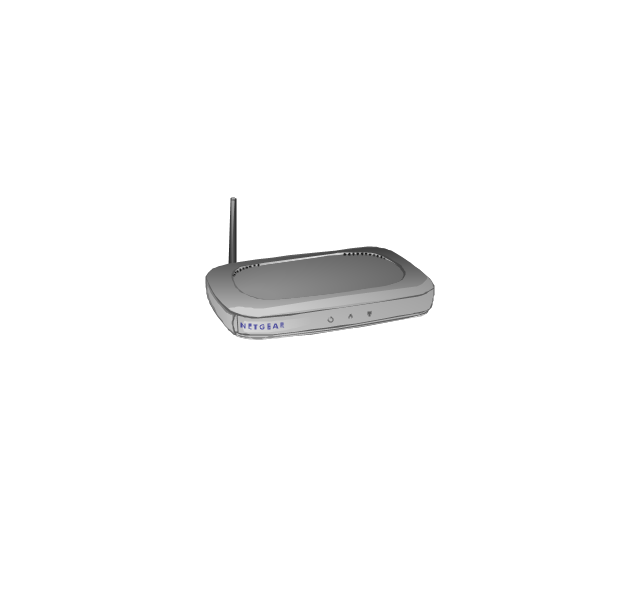
Wireless router
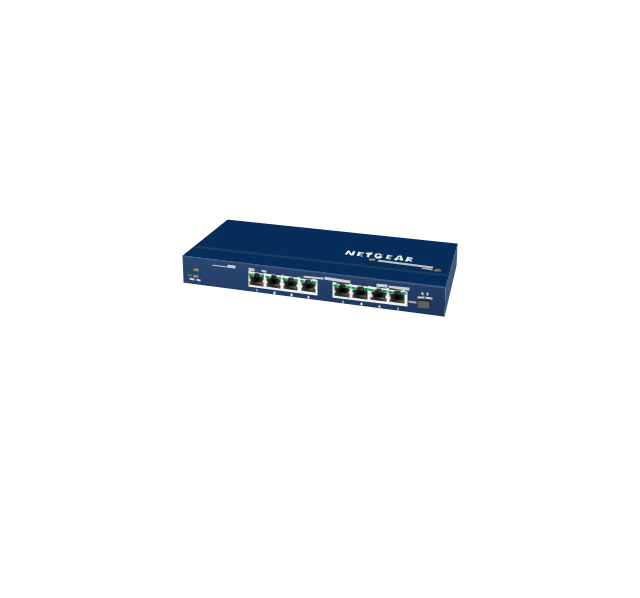
Network switch
iPod Classic

iPhone/ iPod Touch

Xserve RAID
XServe

Apple Thunderbolt Display

Data store

Mac Pro

iMac
RAID
Mainframe
Rack-mountable server
Server

PDA

Cloud

Computer monitor

Workstation
Router
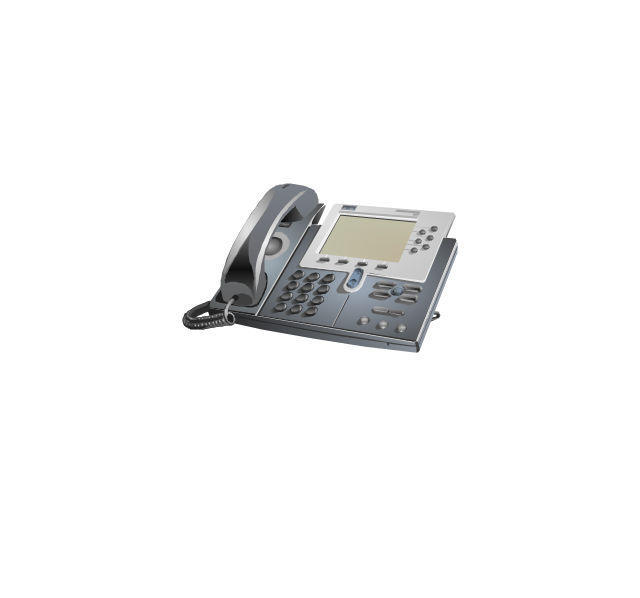
IP Phone
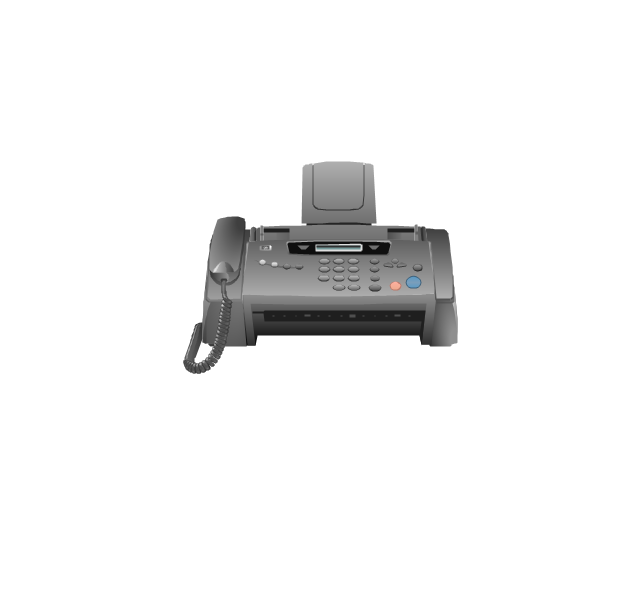
Fax
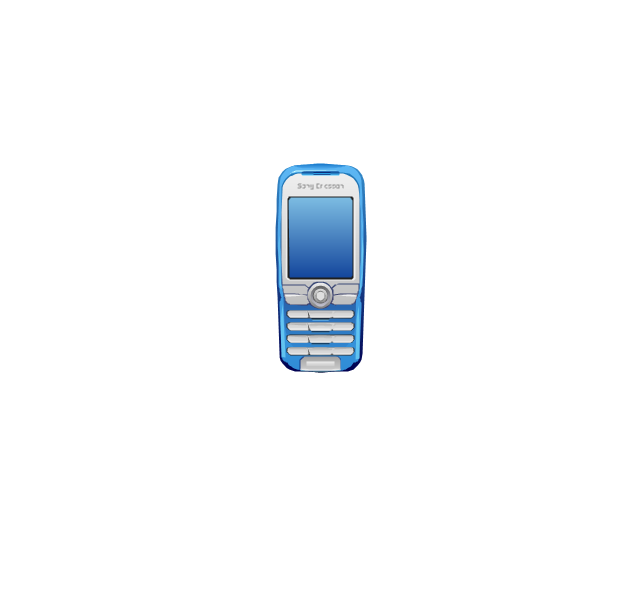
Mobile phone
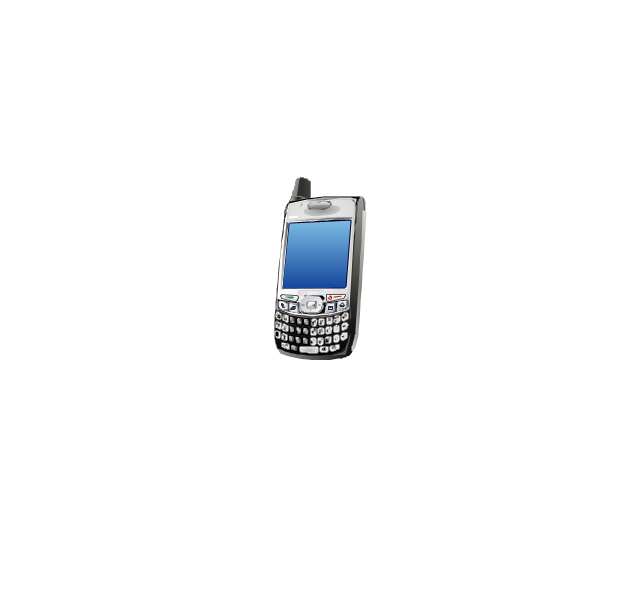
Smartphone
Compact Disk

Mouse

Apple Wireless Mouse

Computer keyboard
Apple Keyboard
Radio tower
Satellite dish
Satellite
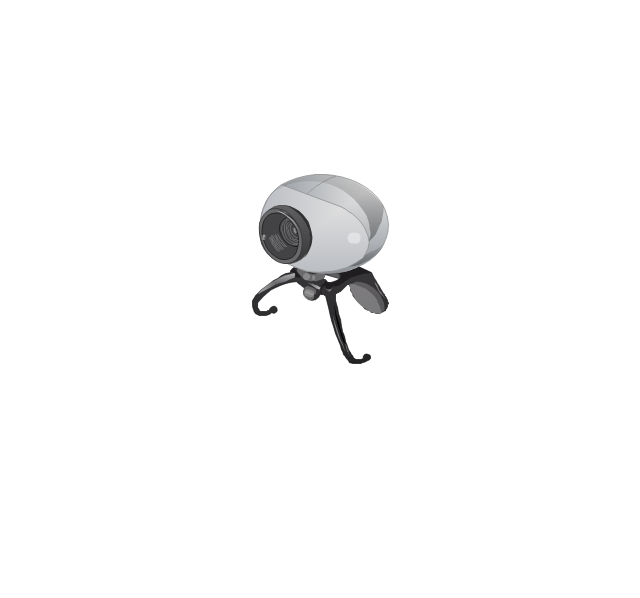
Webcam
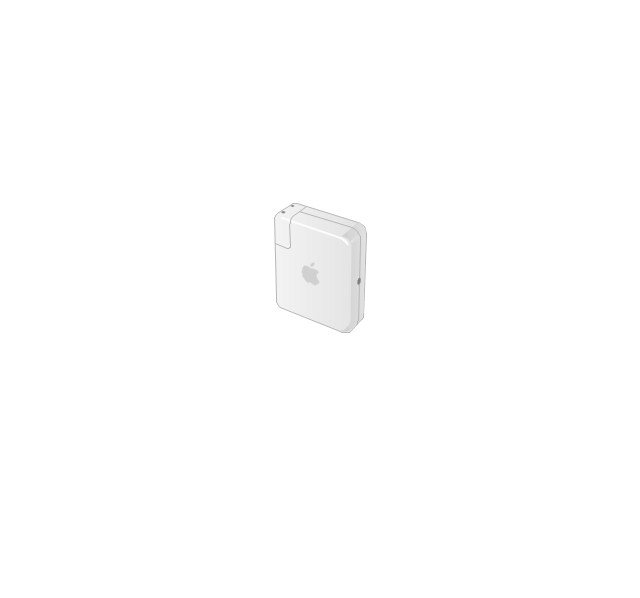
AirPort Extreme

Airport Express
MacBook

iPhone 4

Bubble diagrams in Landscape Design with ConceptDraw DIAGRAM

- Types Of Satellite Images
- Types Of Satellite
- How Many Types Of Satellite In Space And In Image
- Types Of Satellite Network And Its Structure Diagram
- Satellite Types Chart
- Mobile satellite TV network diagram | Cross-Functional Flowchart ...
- Mobile satellite TV network diagram | Standard Universal Audio ...
- Types Of Satellite Communication Flow Chart
- Mobile satellite communication network diagram
- Example Of A Satellite Image
- Satellites | Aerospace - Design Elements | Aerospace - Vector ...
- Satellite Networks Component Diagram
- Using Both Wired and Wireless Connections | Mobile satellite ...
- Satellite Launching For Flow Chart
- Types of Flowchart - Overview | Telecommunication networks ...
- Hybrid satellite and common carrier network diagram | Hybrid ...
- Mobile satellite communication network diagram | Personal area ...
- Hybrid Network Topology | Hybrid satellite and common carrier ...
- Hybrid Network Topology | Star Network Topology | Hybrid satellite ...
- Satellite Flowchart
- ERD | Entity Relationship Diagrams, ERD Software for Mac and Win
- Flowchart | Basic Flowchart Symbols and Meaning
- Flowchart | Flowchart Design - Symbols, Shapes, Stencils and Icons
- Flowchart | Flow Chart Symbols
- Electrical | Electrical Drawing - Wiring and Circuits Schematics
- Flowchart | Common Flowchart Symbols
- Flowchart | Common Flowchart Symbols