GUI Prototyping with ConceptDraw PRO
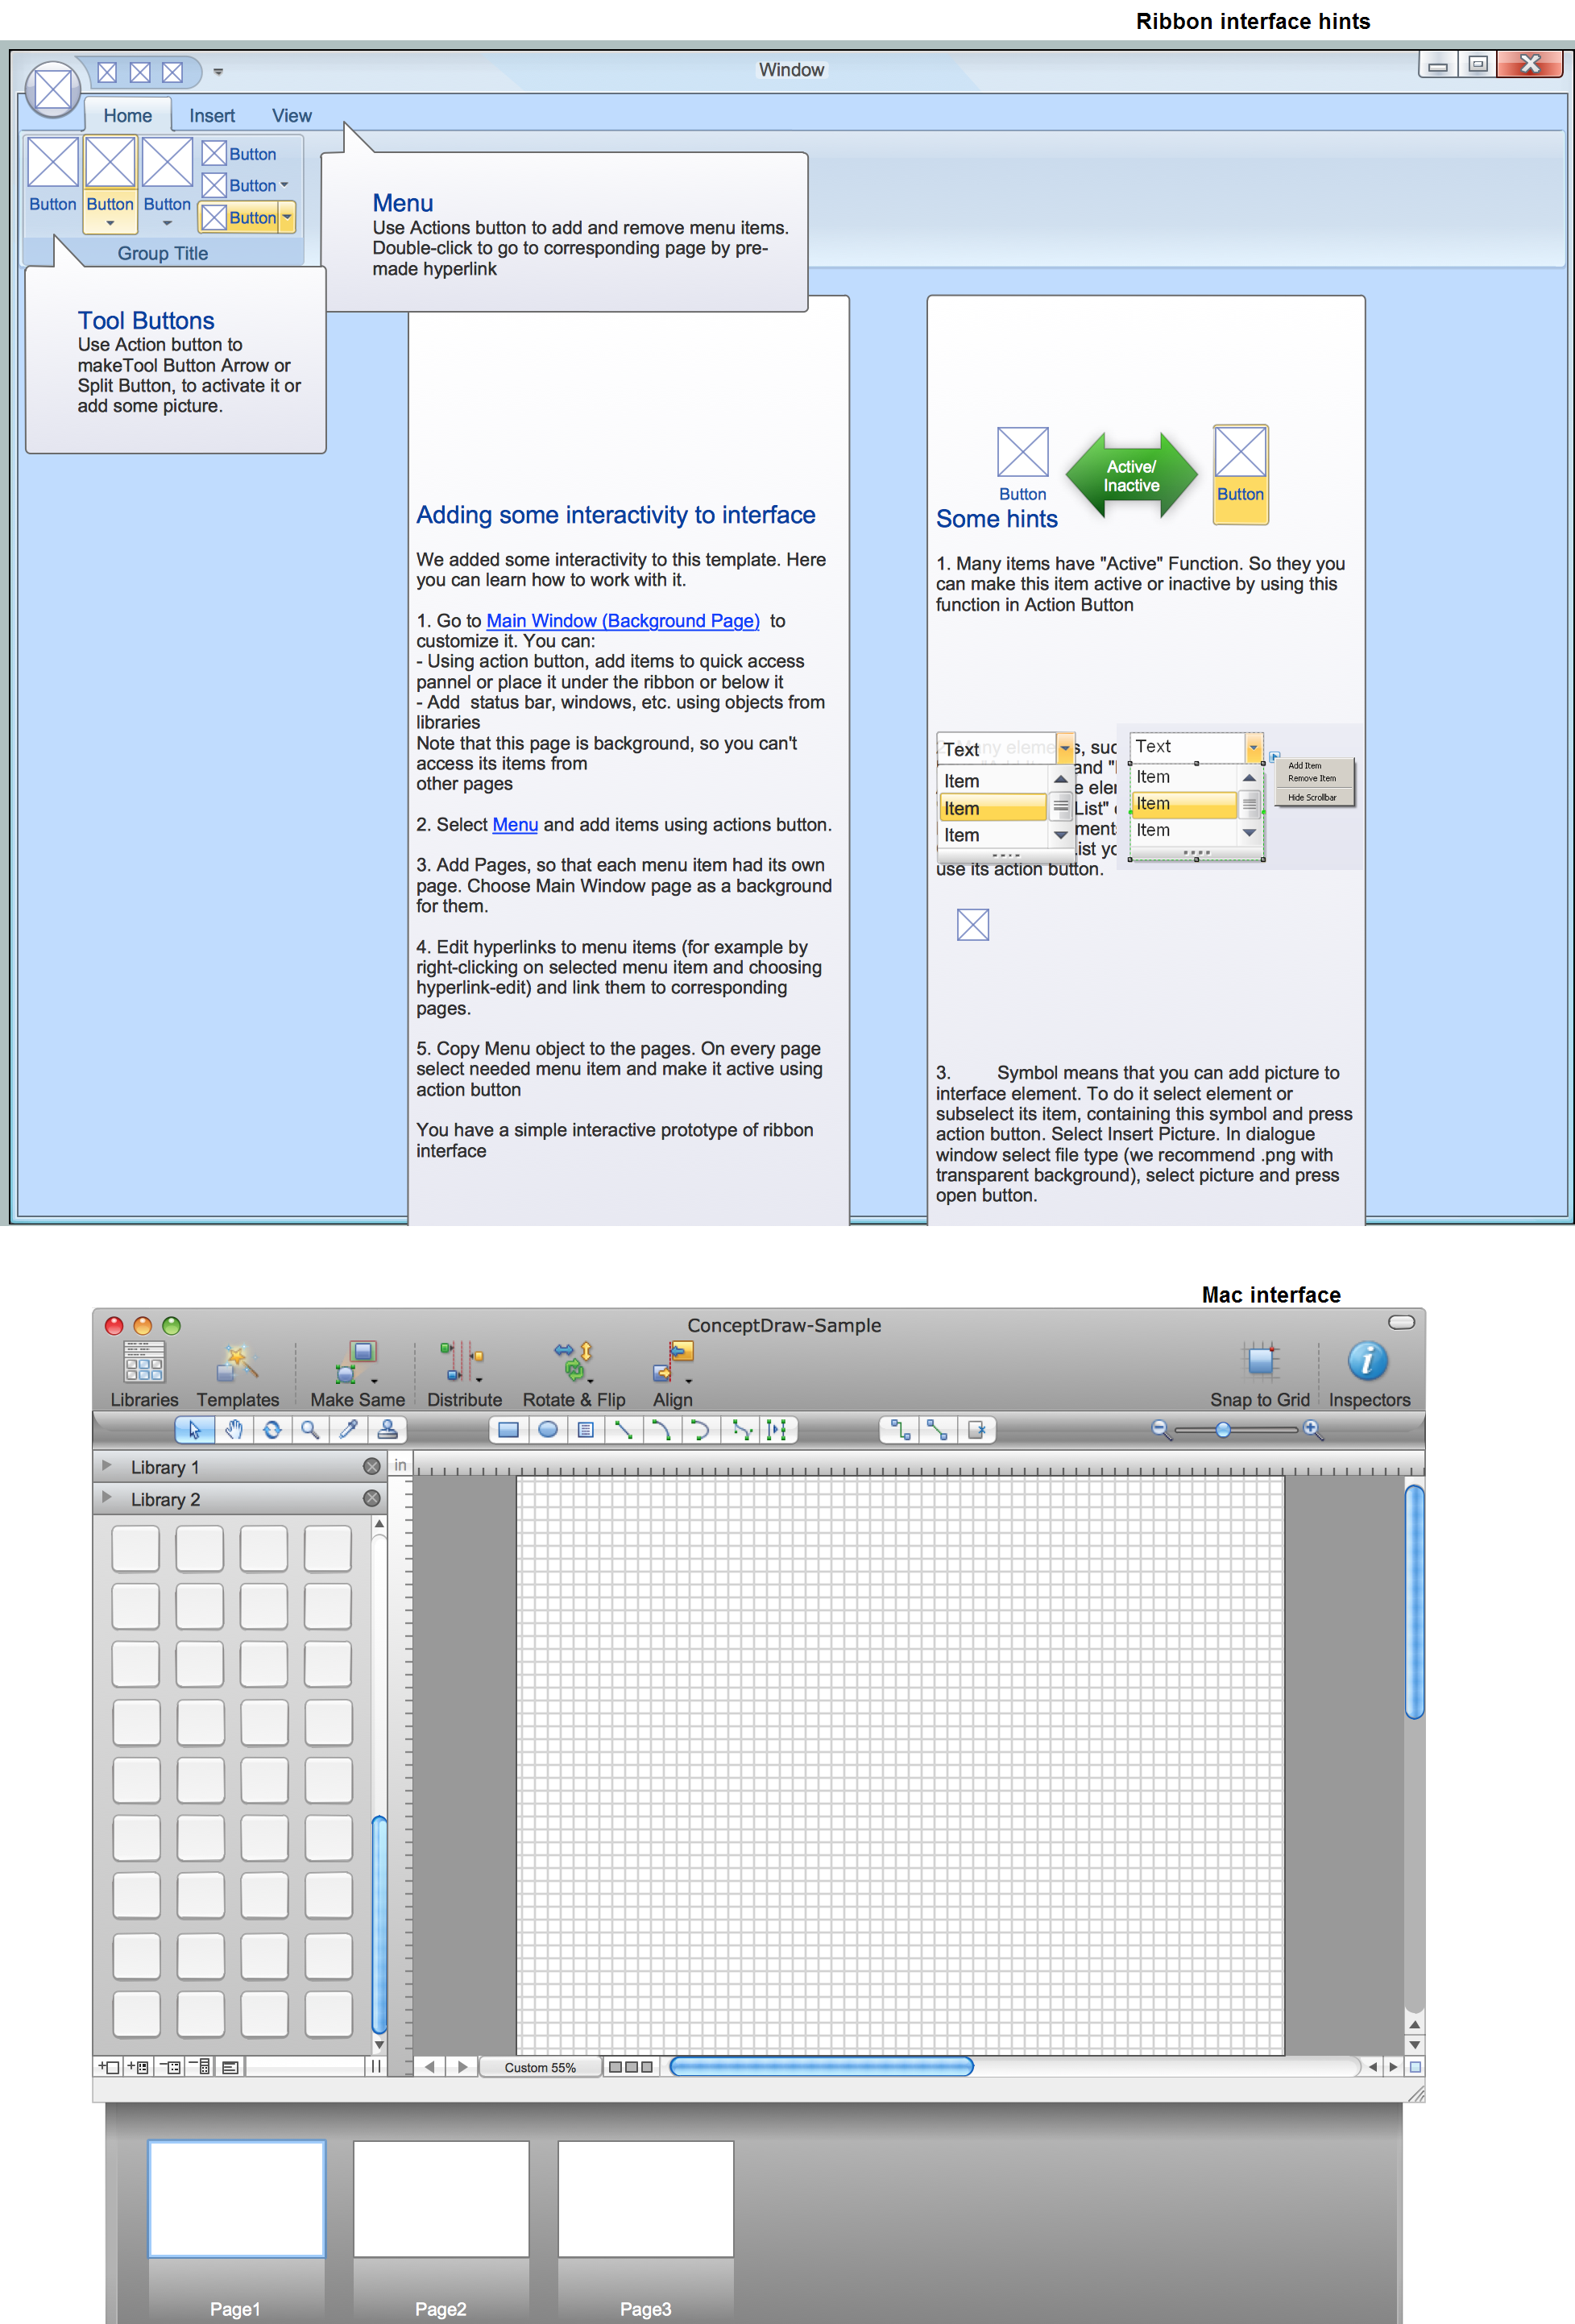
All about prototyping. GUI Prototyping with ConceptDraw. Download prototyping software.Databases Access Objects Model with ConceptDraw PRO
ConceptDraw Basic gives the opportunity of interaction with any ODBC-compatible databases. For this the Database Access Objects Model is provided. All calls to the database are made by certain methods of objects of this model.HelpDesk
How to Create a Network Security Diagram Using ConceptDraw PRO
Network security requires constant work and attention to details. Each user, whether an individual or organization, owns an information, considered to be valuable. The enforcement of network security, whether it be a local network security, or wireless network security is core for creating the secure environment of the daily working processes. Network security is accomplished through hardware and software. Network security system must be sophisticated and modern inside, but simple and understandable for the user. The visual scheme of security system can be presented in the form of a Network Security diagram. ConceptDraw PRO provides the toolkit for network security system visualization with its Network Security Diagram solution.HelpDesk
How to Create a Stakeholder Onion Diagram Using ConceptDraw PRO
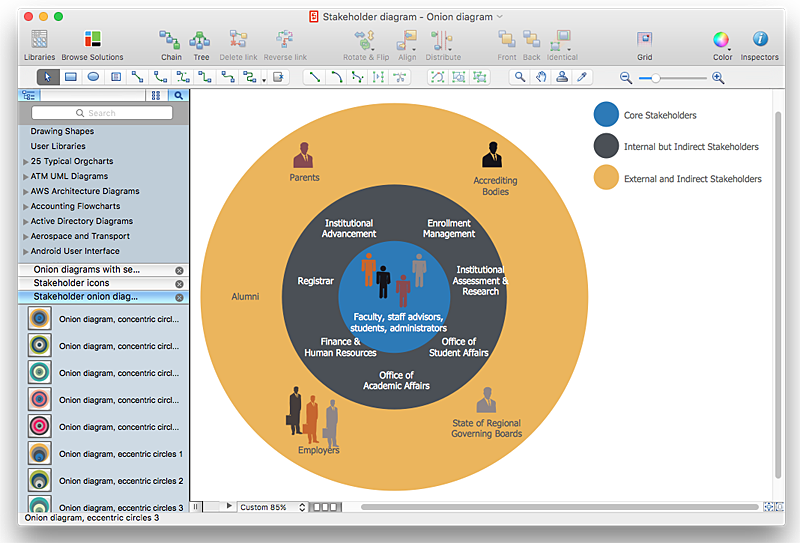
The Stakeholder Onion Diagram is stakeholder analysis tool from the arsenal of project management. It is used to display the relationships of stakeholders to a project goal. An Onion Diagram shows how the stakeholder activities affect the project results. The ConceptDraw Stakeholder Onion Diagram solution is intended to depict how the relationships that subsists in a project environment can influence on a project. A set of libraries and objects provided by this solution make ashort work of visualizing the stakeholder analysis of a project.HelpDesk
How to Connect a Live Object to a Text Data Source
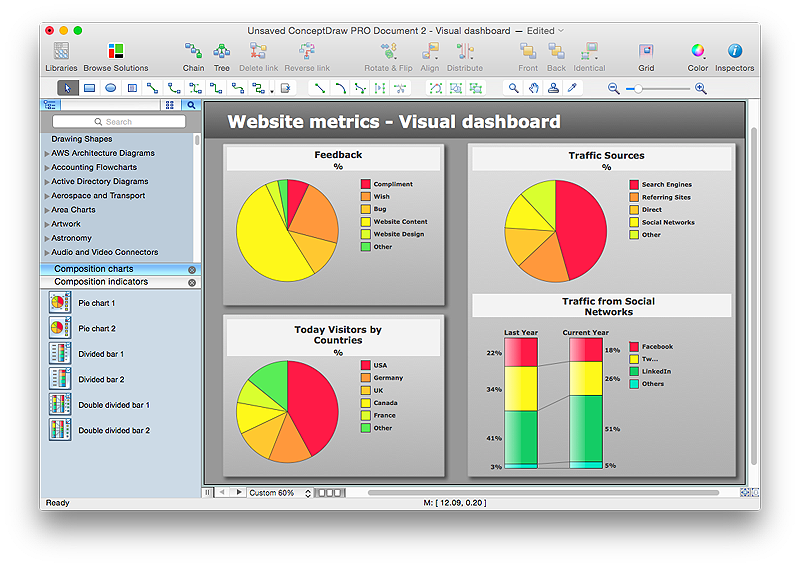
Instruction on how to connect a ConceptDraw live object with data source files in TXT format to visualize the actual values of your performance metrics.
IDEF1X Standard
Use Case Diagrams technology. IDEF1x standard - for work with relational data bases. IDEF1x standard is meant for constructing of conceptual schemes which represent the structure of data in the context of the concerned system, for example, a commercial organization.HelpDesk
How to Draw an Organizational Chart Using ConceptDraw PRO
The organizational chart software is a valuable tool for modern business. It is important for any business to build a clear organizational structure that determines the responsibilities and relationships between different positions in the organization. The clear structured organization - means the clear structured business workflow, which is the core of success in the business. ConceptDraw PRO is an org chart software that allows you to draw an organizational structure of your company quickly and easily.HelpDesk
Event-driven Process Chain (EPC) Diagram Software
An EPC diagram is a type of flowchart used in business process analysis. It shows different business processes through various work flows. The workflows are shown as processes and events that are related to different executes and tasks that allow business workflow to be completed.An EPC diagram shows different business processes through various workflows. The workflows are seen as functions and events that are connected by different teams or people, as well as tasks that allow business processes to be executed. The best thing about this type of enterprise modelling is that creating an EPC diagram is quick and simple as long as you have the proper tool. One of the main usages of the EPC diagrams is in the modelling, analyzing and re-engineering of business processes. With the use of the flowchart, businesses are able to see inefficiencies in the processes and modify to make them more productive. Event-driven process chain diagrams are also used to configure an enterprise resource pla
HelpDesk
Accounting Information Systems Flowchart Symbols
Accounting Information system is a combination of software and hardware, as well as organizational support. Information system - it is not only the software and computers with network equipment, but also a list of instructions and standards which can be notated using Accounting information systems flowchart symbols. All information systems can be divided into information retrieval and data processing systems. Data Flow model is a hierarchical model. Each process can be divided into structural components, that depict by corresponding flowchart symbols, showing the accounting information system in communication with the external environment. The major components of accounting information systems flowchart are: entities, processes, data stores, and data flows. The set of standard accounting information flowchart symbols is intended to show the relationships between the system components. ConceptDraw PRO can help to draw clear accounting information system diagrams using special flowchart symbols.HelpDesk
How to Draw a Histogram in ConceptDraw PRO
Histogram is a diagram used to visualize data through bars of variable heights. Making histogram can be helpful if you need to show data covering various periods (hours, days, weeks, etc). When the vertical column of the histogram refer to frequency it shows how many times any event happens. It is a Frequency histogram. A bar chart diagram is similar to a histogram, but in contrast to a bar chart a histogram represents the number how many times there have been certain data values. You can use a histogram to depict continual data flow such as temperature, time, etc. You can effortlessly draw histograms using the Histograms solution for CnceptDraw PRO. Making a histogram can by very useful to represent various statistical data.HelpDesk
How to Create Infographics that Help People Eat Healthy
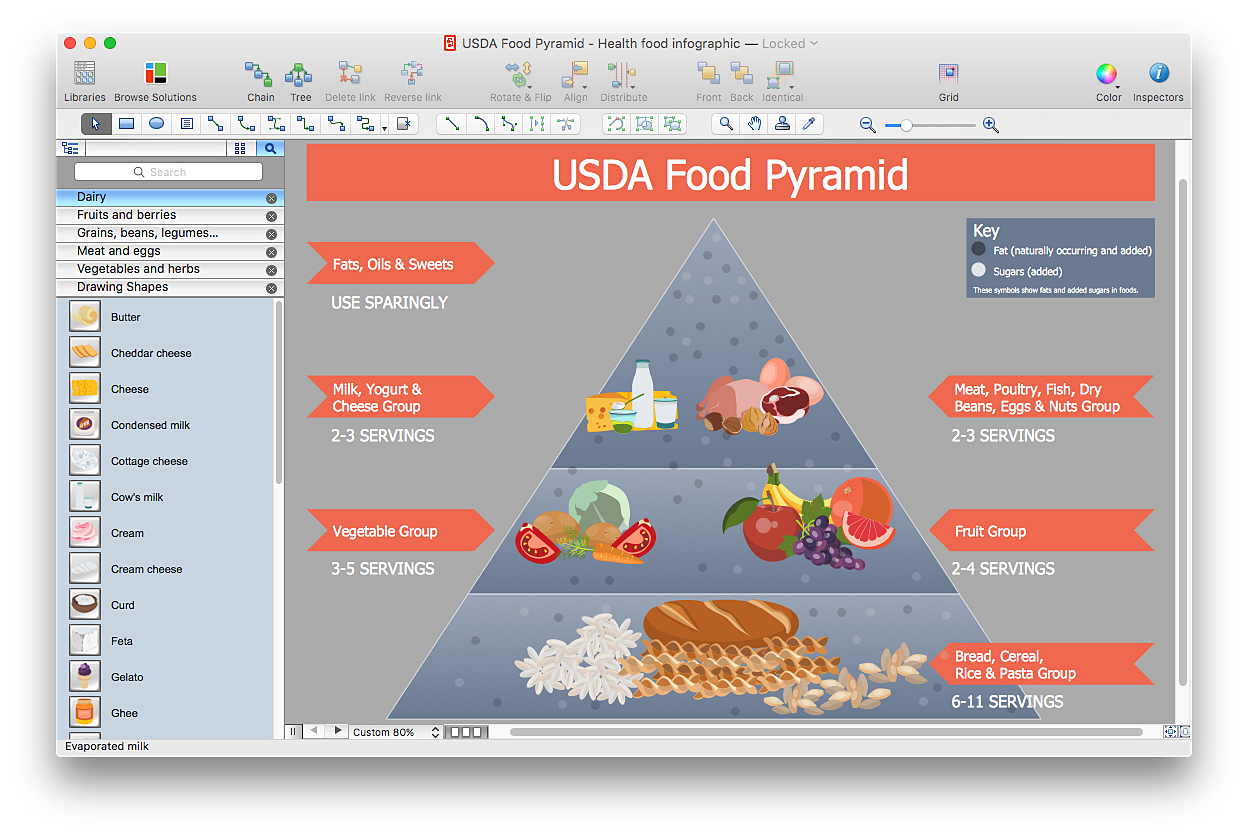
The most effective manner of presenting information on healthy diet and food nutrition is using various visualizations such as charts or infographics. To help easily create infographics and diagrams of healthy eating, ConceptDraw has provided the Health Food solution to its Solution Park. It contains vector stencil libraries of healthy eating options, samples of diagrams and infographics, and a set of templates to help you create your own diagrams, infographics and even adds. Using ConceptDraw PRO you can easily create and share healthy food recipes and materials about the proper nutrition.HelpDesk
How to Start Drawing a Diagram on Mac
There are many types of diagrams, you can create using Conceptdraw PRO: network diagrams, organizational charts, flow charts, workflow diagrams, technical schemes and building plans. However, there are the same basic steps to start creating almost all of them. Here tutorial we will show how to create a simple chart using a template, and how to add shapes to your drawing using libraries.
In this tutorial we will explain how to create a simple chart in ConceptDraw PRO using a template, and how to use the library objects.
HelpDesk
How to Create a Release Burn-Down Chart Using ConceptDraw PRO
The Agile methodology provides project teams the ability to quickly adapt the project to the current situation and thus achieve maximum productivity. According the Scrum method the steps needed to fulfill the project goal breaks down by using short sprints or iterations. The iterations together with an extensive collaboration can increase productivity by better understanding the entire flow of a project. A release burn-down chart is used to track a progress on a Scrum project. The ConceptDraw Scrum Workflow Solution makes it easy for Agile project team to build any professional Scrum diagram such as a Release velocity chart, Release burn-down chart, Sprint burn-down chart, or a Team velocity chart.- Mesh Network Topology Diagram | Fully Connected Network ...
- Wide area network (WAN) topology . Computer and Network ...
- Different Types Of Network Security Devices
- Hotel Network Topology Diagram | Cisco Routers. Cisco icons ...
- Network Layout Floor Plans | Design elements - Network layout ...
- Copying Service Process Flowchart. Flowchart Examples | Hotel ...
- Hotel Network Topology Diagram | Wireless Network Topology ...
- Cisco Network Equipment Vector Stencils
- 5 Level pyramid model diagram - Information systems types ...
- Basic Flowchart Symbols and Meaning | Workflow Diagram ...
- Design elements - Transmission paths | Design elements - Power ...
- Design elements - VHF UHF SHF | Wireless network . Computer and ...
- Organizational Charts | Basic Flowchart Symbols and Meaning ...
- Hybrid satellite and common carrier network diagram | 3D Network ...
- Sales Process Management | Technical Flow Chart | How to ...
- Copying Service Process Flowchart. Flowchart Examples | How to ...
- 2-bit ALU - Logic gate diagram | Computer network - Vector stencils ...
- Basic Flowchart Symbols and Meaning | Process Flowchart ...
- How To use House Electrical Plan Software | Wiring Diagrams with ...
- Network diagrams with ConceptDraw PRO | UML Diagram | Bubble ...
- ERD | Entity Relationship Diagrams, ERD Software for Mac and Win
- Flowchart | Basic Flowchart Symbols and Meaning
- Flowchart | Flowchart Design - Symbols, Shapes, Stencils and Icons
- Flowchart | Flow Chart Symbols
- Electrical | Electrical Drawing - Wiring and Circuits Schematics
- Flowchart | Common Flowchart Symbols
- Flowchart | Common Flowchart Symbols


