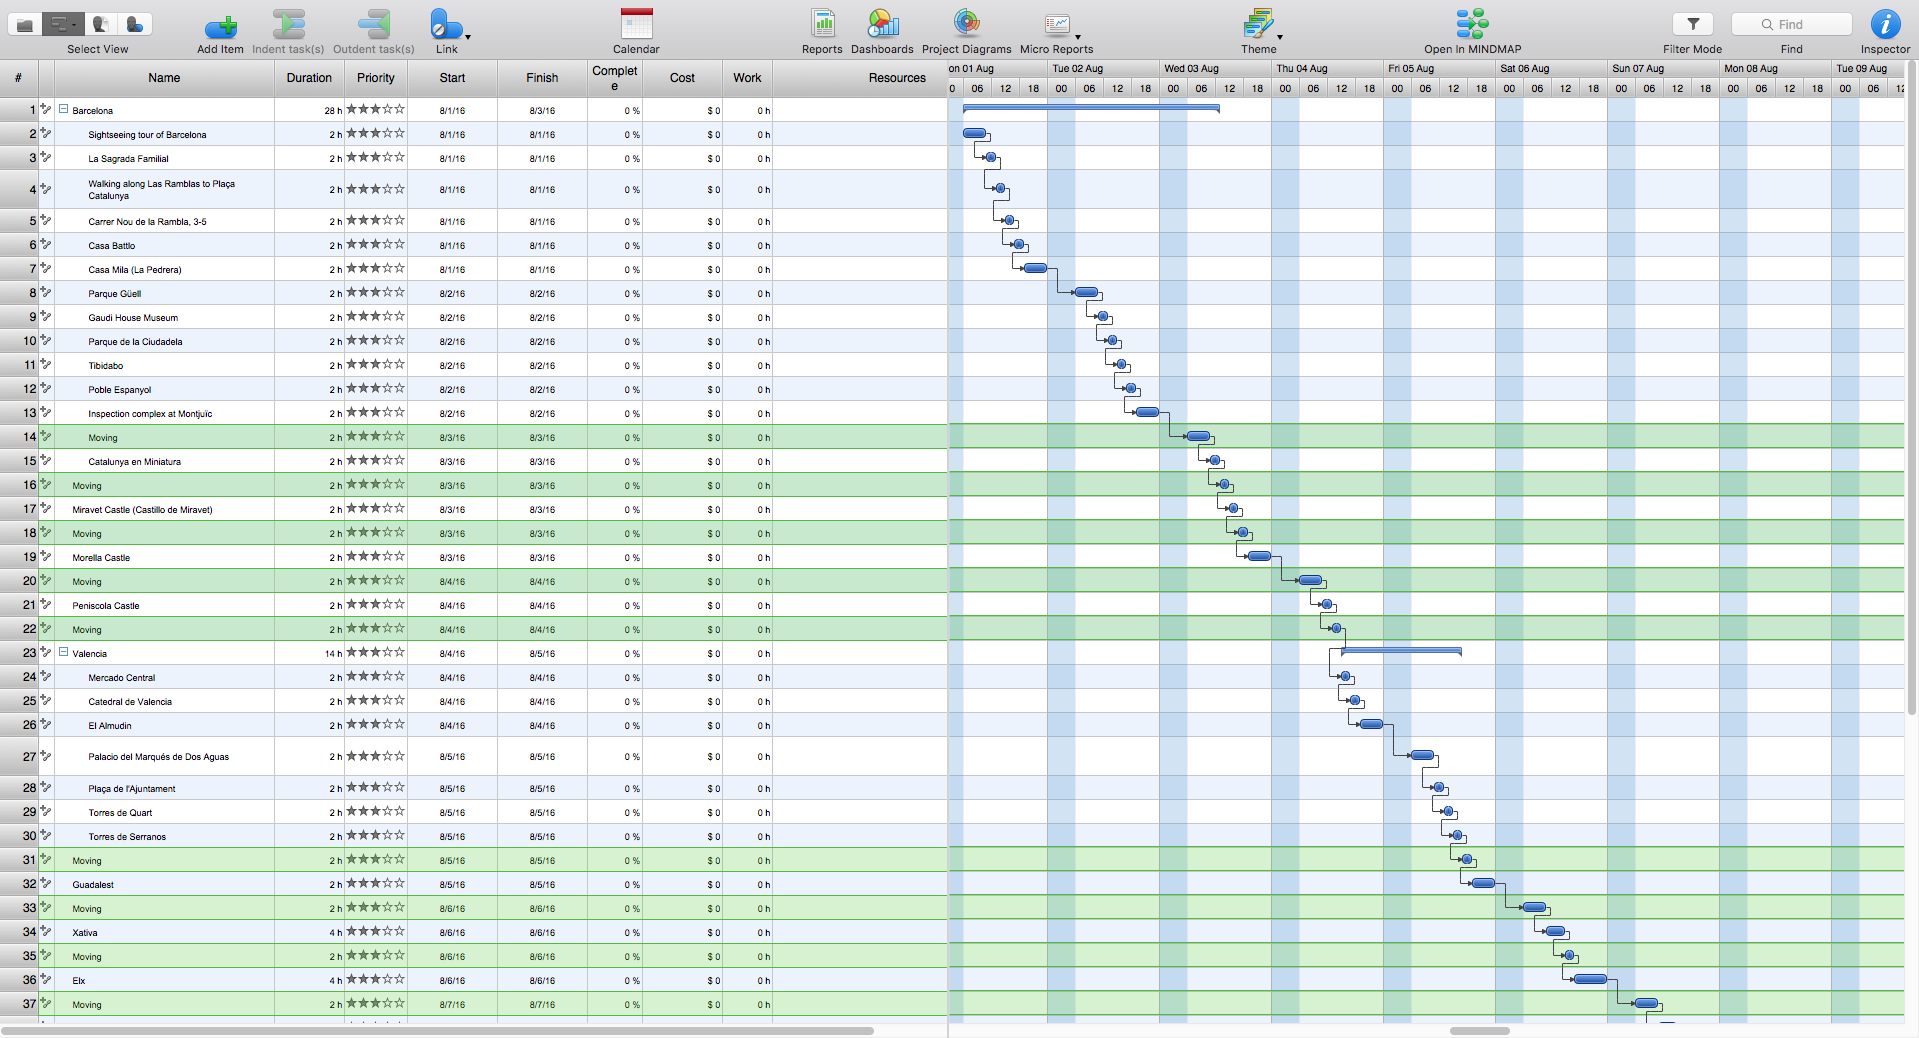
How to Create Presentation of Your Project Gantt Chart
During the planning, discussing and execution of a project you may need to prepare a presentation using project views such as the Gantt Chart, Multiproject Dashboard or Resource Usage View. It’s easy do with ConceptDraw PROJECT!Examples of Flowcharts, Org Charts and More
ConceptDraw examples covers a broad spectrum of business graphics categories. We separated all the graphic documents on application areas and had produced multiple solutions for each of them. ConceptDraw provides a wide variety of examples such as flowcharts, organizational charts, business charts, UML diagrams, database and ERD, directional map, network diagrams and lots more. Each solution accommodates 10+ examples that shows specific application cases of a diagram. ConceptDraw STORE is an application for downloading solutions with examples, templates and stencil libraries. Please choose any examples you are interested in, alternatively download them for free; you will need to install ConceptDraw to view them. As you will see, ConceptDraw is very powerful, you can use more than 10000 symbols, examples, and many pre-drawn templates, to create your own spectacular flowcharts, business diagrams, network diagrams and lots more, effortlessly, and in no time at all.
Basic Flowchart Symbols and Meaning
Flowchart Symbols and Meaning - Provides a visual representation of basic flowchart symbols and their proposed use in professional workflow diagram, standard process flow diagram and communicating the structure of a well-developed web site, as well as their correlation in developing on-line instructional projects. See flowchart's symbols by specifics of process flow diagram symbols and workflow diagram symbols.
What is Gantt Chart (historical reference)
Historical reference about the Gantt chart.Successful Strategic Plan
This sample shows the Strategic Plan of the Broadband Lifecycle that was developed by Strategic Networks Group. The Broadband Lifecycle represents the advance of the broadband investments.Activity Network Diagram Method
Activity Network Diagram - This sample was created in ConceptDraw PRO diagramming and vector drawing software using the Seven Management and Planning Tools solution from the Management area of ConceptDraw Solution Park.This sample shows the PERT (Program Evaluation Review Technique) chart of the request on proposal. A request for proposal (RFP) is a request of the company or the organization to potential suppliers to submit the business proposals for service or goods that it is interested to purchase. The RFP is represented on the initial procurement stage and allows to define the risks and benefits.
Planning a Trip with ConceptDraw Project
Planning a trip is real work; and the better this work is done, the more chances you have to enjoy an interesting itinerary and the trip in general. A good plan is never overloaded. It is always good to stick to the golden mean. Surely, you can create a perfectly accurate and detailed route. However, following it may become a hard task, which will turn your trip from a pleasure into a race to fulfil your own plan.How To Show Project Progress Peport on Web
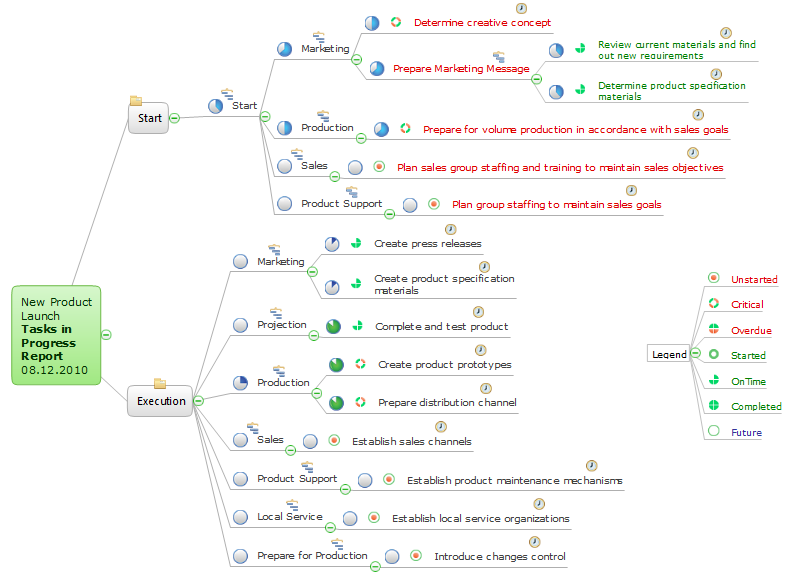
Project progress on web: delivering project status to remote teams and stakeholders via Skype.
Visual Presentations Made Easy with Diagramming Software
Automatically create a presentation-quality diagram in one click with ConceptDraw PRO.
Workflow Diagram
Workflow diagram visually describes an repeatable pattern of organizational activity powered by resources. Workflow diagram explains and document the process flow which needs to be organized or exists and needs to be learned and executed. Workflow diagram can be part of project documentation, company policies or sertification process to comply a standard.The workflow represents the transferring of data, documents or tasks during a work process. To make it easier to study and analyze working processes, and to present them in a simple visual manner, workflow diagrams are used. To create these diagrams professional use workflow diagram maker software ConceptDraw PRO.
- Turning Gantt Into Flow Diagram
- Gantt Chart And Network Diagram With More Example Pdf
- How To Convert Gantt Chart To Tree
- How to Draw a Gantt Chart Using ConceptDraw PRO | How to ...
- How to Make a Mind Map from a Project Gantt Chart | How to Quickly ...
- Gantt Chart Template Xls
- Process Flow Diagram Example Xls
- Java Create Gantt Chart
- Gant Chart in Project Management | Gantt chart examples | What ...
- Gantt Chart Free Template
- ERD | Entity Relationship Diagrams, ERD Software for Mac and Win
- Flowchart | Basic Flowchart Symbols and Meaning
- Flowchart | Flowchart Design - Symbols, Shapes, Stencils and Icons
- Flowchart | Flow Chart Symbols
- Electrical | Electrical Drawing - Wiring and Circuits Schematics
- Flowchart | Common Flowchart Symbols
- Flowchart | Common Flowchart Symbols


