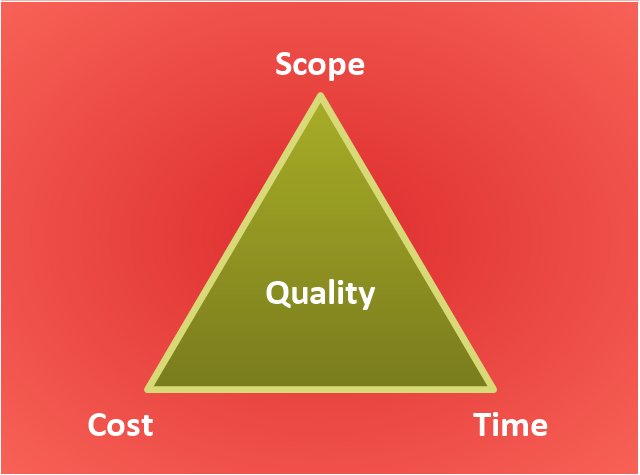
"The Project Management Triangle (called also Triple Constraint or the Iron Triangle) is a model of the constraints of project management. It is a graphic aid where the three attributes show on the corners of the triangle to show opposition. It is useful to help with intentionally choosing project biases, or analyzing the goals of a project. It is used to illustrate that project management success is measured by the project team's ability to manage the project, so that the expected results are produced while managing time and cost." [Project management triangle. Wikipedia]
The pyramid chart example "Project management triangle diagram" was redesigned using the ConceptDraw PRO diagramming and vector drawing software from Wikimedia Commons file Project-triangle-en.svg. [commons.wikimedia.org/ wiki/ File:Project-triangle-en.svg]
The project management triangle chart example is included in the Pyramid Diagrams solution from the Marketing area of ConceptDraw Solution Park.
Pyramid diagram
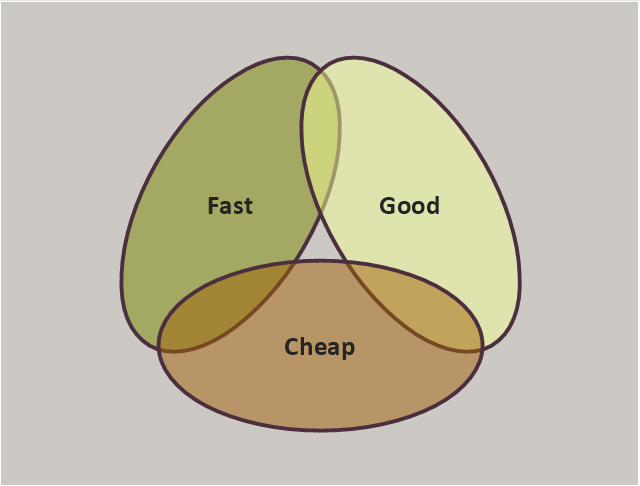
"You are given the options of Fast, Good and Cheap, and told to pick any two. Here Fast refers to the time required to deliver the product, Good is the quality of the final product, and Cheap refers to the total cost of designing and building the product. This triangle reflects the fact that the three properties of a project are interrelated, and it is not possible to optimize all three – one will always suffer."
[Project management triangle. Wikipedia]
A Venn-diagram style chart of the "project triangle" showing visually the potential overlaps between speed, quality and low cost, along with the "inability" to accomplish all three.
The diagram example "Project triangle chart" was redesigned using the ConceptDraw PRO diagramming and vector drawing software from Wikimedia Commons file Project-triangle.svg. [commons.wikimedia.org/ wiki/ File:Project-triangle.svg]
This file is made available under the Creative Commons CC0 1.0 Universal Public Domain Dedication. [creativecommons.org/ publicdomain/ zero/ 1.0/ deed.en]
The triangular chart sample "Project triangle chart" is included in the Pyramid Diagrams solution from the Marketing area of ConceptDraw Solution Park.
Triangular diagram
Use this triangular Venn diagram template to create your own marketing pyramid diagrams using the ConceptDraw PRO diagramming and vector drawing software.
The triangular Venn diagram template is included in the Pyramid Diagrams solution from the Marketing area of ConceptDraw Solution Park.
www.conceptdraw.com/ solution-park/ marketing-pyramid-diagrams
The triangular Venn diagram template is included in the Pyramid Diagrams solution from the Marketing area of ConceptDraw Solution Park.
www.conceptdraw.com/ solution-park/ marketing-pyramid-diagrams
Triangular Venn diagram

HelpDesk
How to Create a Timeline Diagram in ConceptDraw PRO

 Pyramid Diagrams
Pyramid Diagrams solution extends ConceptDraw PRO software with templates, samples and library of vector stencils for drawing the marketing pyramid diagrams.
- Project management diagram
- Pyramid Diagram | Project management triangle diagram | Pyramid ...
- Pyramid diagram template | Triangular pyramid diagram template
- Pyramid Diagram | Project triangle chart | Triangular chart template ...
- Pyramid Diagram | Project triangle chart | Triangle diagram template ...
- Pyramid Diagram | Project management skills diagram | Software ...
- Project triangle Venn diagram template | Pyramid Diagram ...
- Project triangle Venn diagram template
- Venn diagrams with ConceptDraw PRO | Pyramid Diagram | Project ...
- Triangular chart template | Triangular pyramid diagram template ...
- Pyramid Diagram | Gantt charts for planning and scheduling projects ...
- Pyramid Diagram | Pyramid Diagram | Project — Working With Costs ...
- Audit flowchart - Project management process | Cross-Functional ...
- Pyramid Diagram | Pyramid Diagram | Pyramid Diagram | Triangle ...
- Project —Task Trees and Dependencies | PERT chart - Project ...
- Examples of Flowcharts, Org Charts and More | Business Diagram ...
- Pyramid Diagram | How to Make a Mind Map from a Project Gantt ...
- Pyramid Diagram
- Pyramid Diagram | Pyramid Diagram | Software for Creating SWOT ...
- Pyramid Diagram
- ERD | Entity Relationship Diagrams, ERD Software for Mac and Win
- Flowchart | Basic Flowchart Symbols and Meaning
- Flowchart | Flowchart Design - Symbols, Shapes, Stencils and Icons
- Flowchart | Flow Chart Symbols
- Electrical | Electrical Drawing - Wiring and Circuits Schematics
- Flowchart | Common Flowchart Symbols
- Flowchart | Common Flowchart Symbols