Flow chart Example. Warehouse Flowchart
Warehouse Flowcharts are different diagrams describing wharehousing and inventory menagement processes. Typical purposes of warehouse flowcharts are evaluating warehouse performance and organizational performance, measuring efficiency of customer service. This type of workflow diagrams can be used for identifying any disconnection between business activities and business objectives.Standard warehousing process flow diagram and standard workflow diagram used for process identification for further evaluating effectiveness and profitability of overall business process. Use the ConceptDraw PRO diagramming and vector drawing software extended with the Flowcharts solution from the Diagrams area of ConceptDraw Solution Park to design your own workflow diagrams, process flow diagram and flow charts. Need to use Process Flow Diagram for designing Warehouse packages flow.

Workflow Diagram
Workflow diagram visually describes an repeatable pattern of organizational activity powered by resources. Workflow diagram explains and document the process flow which needs to be organized or exists and needs to be learned and executed. Workflow diagram can be part of project documentation, company policies or sertification process to comply a standard.The workflow represents the transferring of data, documents or tasks during a work process. To make it easier to study and analyze working processes, and to present them in a simple visual manner, workflow diagrams are used. To create these diagrams professional use workflow diagram maker software ConceptDraw PRO.
Timeline charts presents events and time periods on a chronological scale. They are used in project management to visualize project milestones and upper level phases, and show project progress.
"Within the framework of project management, a milestone is an event that receives special attention. It is often put at the end of a stage to mark the completion of a work package or phase. Milestones can be put before the end of a phase so that corrective actions can be taken, if problems arise, and the deliverable can be completed on time.
In addition to signaling the completion of a key deliverable, a milestone may also signify an important decision or the derivation of a critical piece of information, which outlines or affects the future of a project. In this sense, a milestone not only signifies distance traveled (key stages in a project) but also indicates direction of travel since key decisions made at milestones may alter the route through the project plan." [Milestone (project management). Wikipedia]
This timeline diagram example was created using the ConceptDraw PRO diagramming and vector drawing software extended with the Timeline Diagrams solution from the Management area of ConceptDraw Solution Park.
 Business Process Workflow Diagrams
The Business Process Workflow Diagrams solution enhances the ConceptDraw PRO v10 functionality with predesigned examples, samples and a numerous collection of predesigned vector objects of workflow chart elements, icons, arrows, connectors, and varied wor
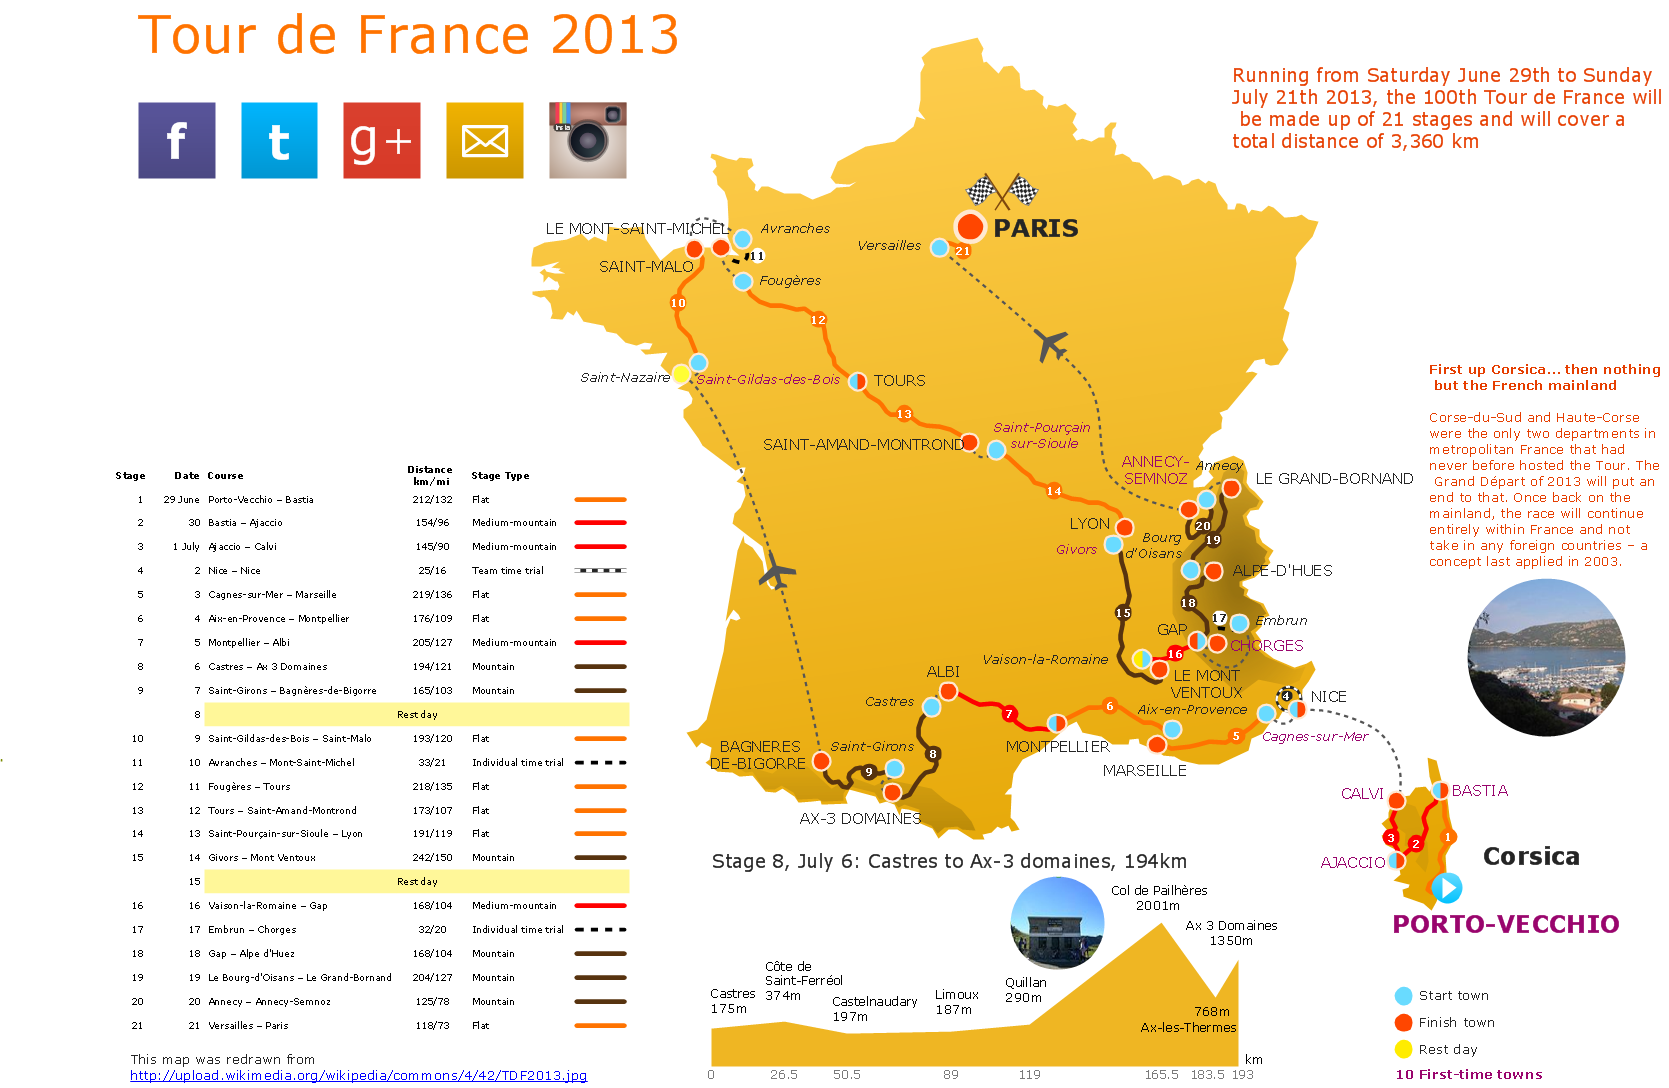
Travel Infographics
Creating Travel infographics is super-easy with ConceptDraw.UML Use Case Diagram Example Social Networking Sites Project
UML Diagrams Social Networking Sites Project. This sample was created in ConceptDraw PRO diagramming and vector drawing software using the UML Use Case Diagram library of the Rapid UML Solution from the Software Development area of ConceptDraw Solution Park.This sample shows the Facebook Socio-health system and is used at the projection and creating of the social networking sites.
 Computer and Networks Area
The solutions from Computer and Networks Area of ConceptDraw Solution Park collect samples, templates and vector stencils libraries for drawing computer and network diagrams, schemes and technical drawings.
How To Create a Workflow Diagram
A workflow diagram is less general notation than a process flow diagram. Workflow as a term can apply to organizational process which involves people, resources, documents, sort of data, for instance; whereas a process is general collection of steps occuring in any sort of activity. That is why process flow diagram can be used as workflow diagram to describe business process, data flow or department interactions.The fastest way to create a workflow diagram is using pre-designed workflow template. ConceptDraw PRO with the Workflow Diagrams solution delivers rich set of workflow diagram templates you may start from.
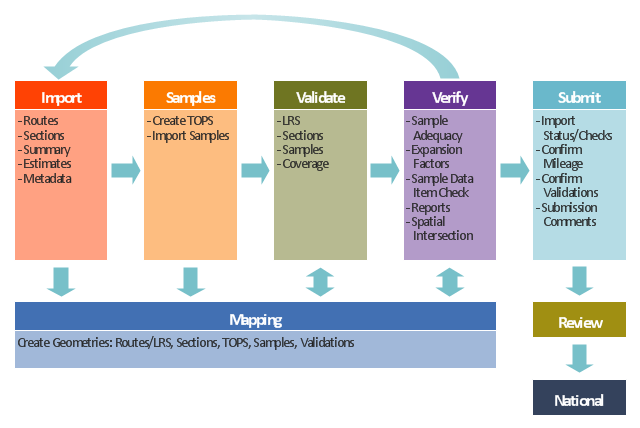
This TQM diagram example was redesigned from the illustration of the Highway Performance Monitoring System (HPMS) Field Manual from the website of the Federal Highway Administration (FHWA).
[fhwa.dot.gov/ policyinformation/ hpms/ fieldmanual/ chapter7.cfm]
"Highway Performance Monitoring System (HPMS).
The HPMS is a national level highway information system that includes data on the extent, condition, performance, use and operating characteristics of the nation's highways. The HPMS contains administrative and extent of system information on all public roads, while information on other characteristics is represented in HPMS as a mix of universe and sample data for arterial and collector functional systems. Limited information on travel and paved miles is included in summary form for the lowest functional systems.
HPMS was developed in 1978 as a continuing database, replacing the special biennial condition studies that had been conducted since 1965. The HPMS has been modified several times since its inception. Changes have been made to reflect changes in the highway systems, legislation, and national priorities, to reflect new technology, and to consolidate or streamline reporting requirements." [fhwa.dot.gov/ policyinformation/ hpms.cfm]
The TQM flowchart example "Software workflow diagram" was created using the ConceptDraw PRO diagramming and vector drawing software extended with the Total Quality Management (TQM) Diagrams solution from the Quality area of ConceptDraw Solution Park.
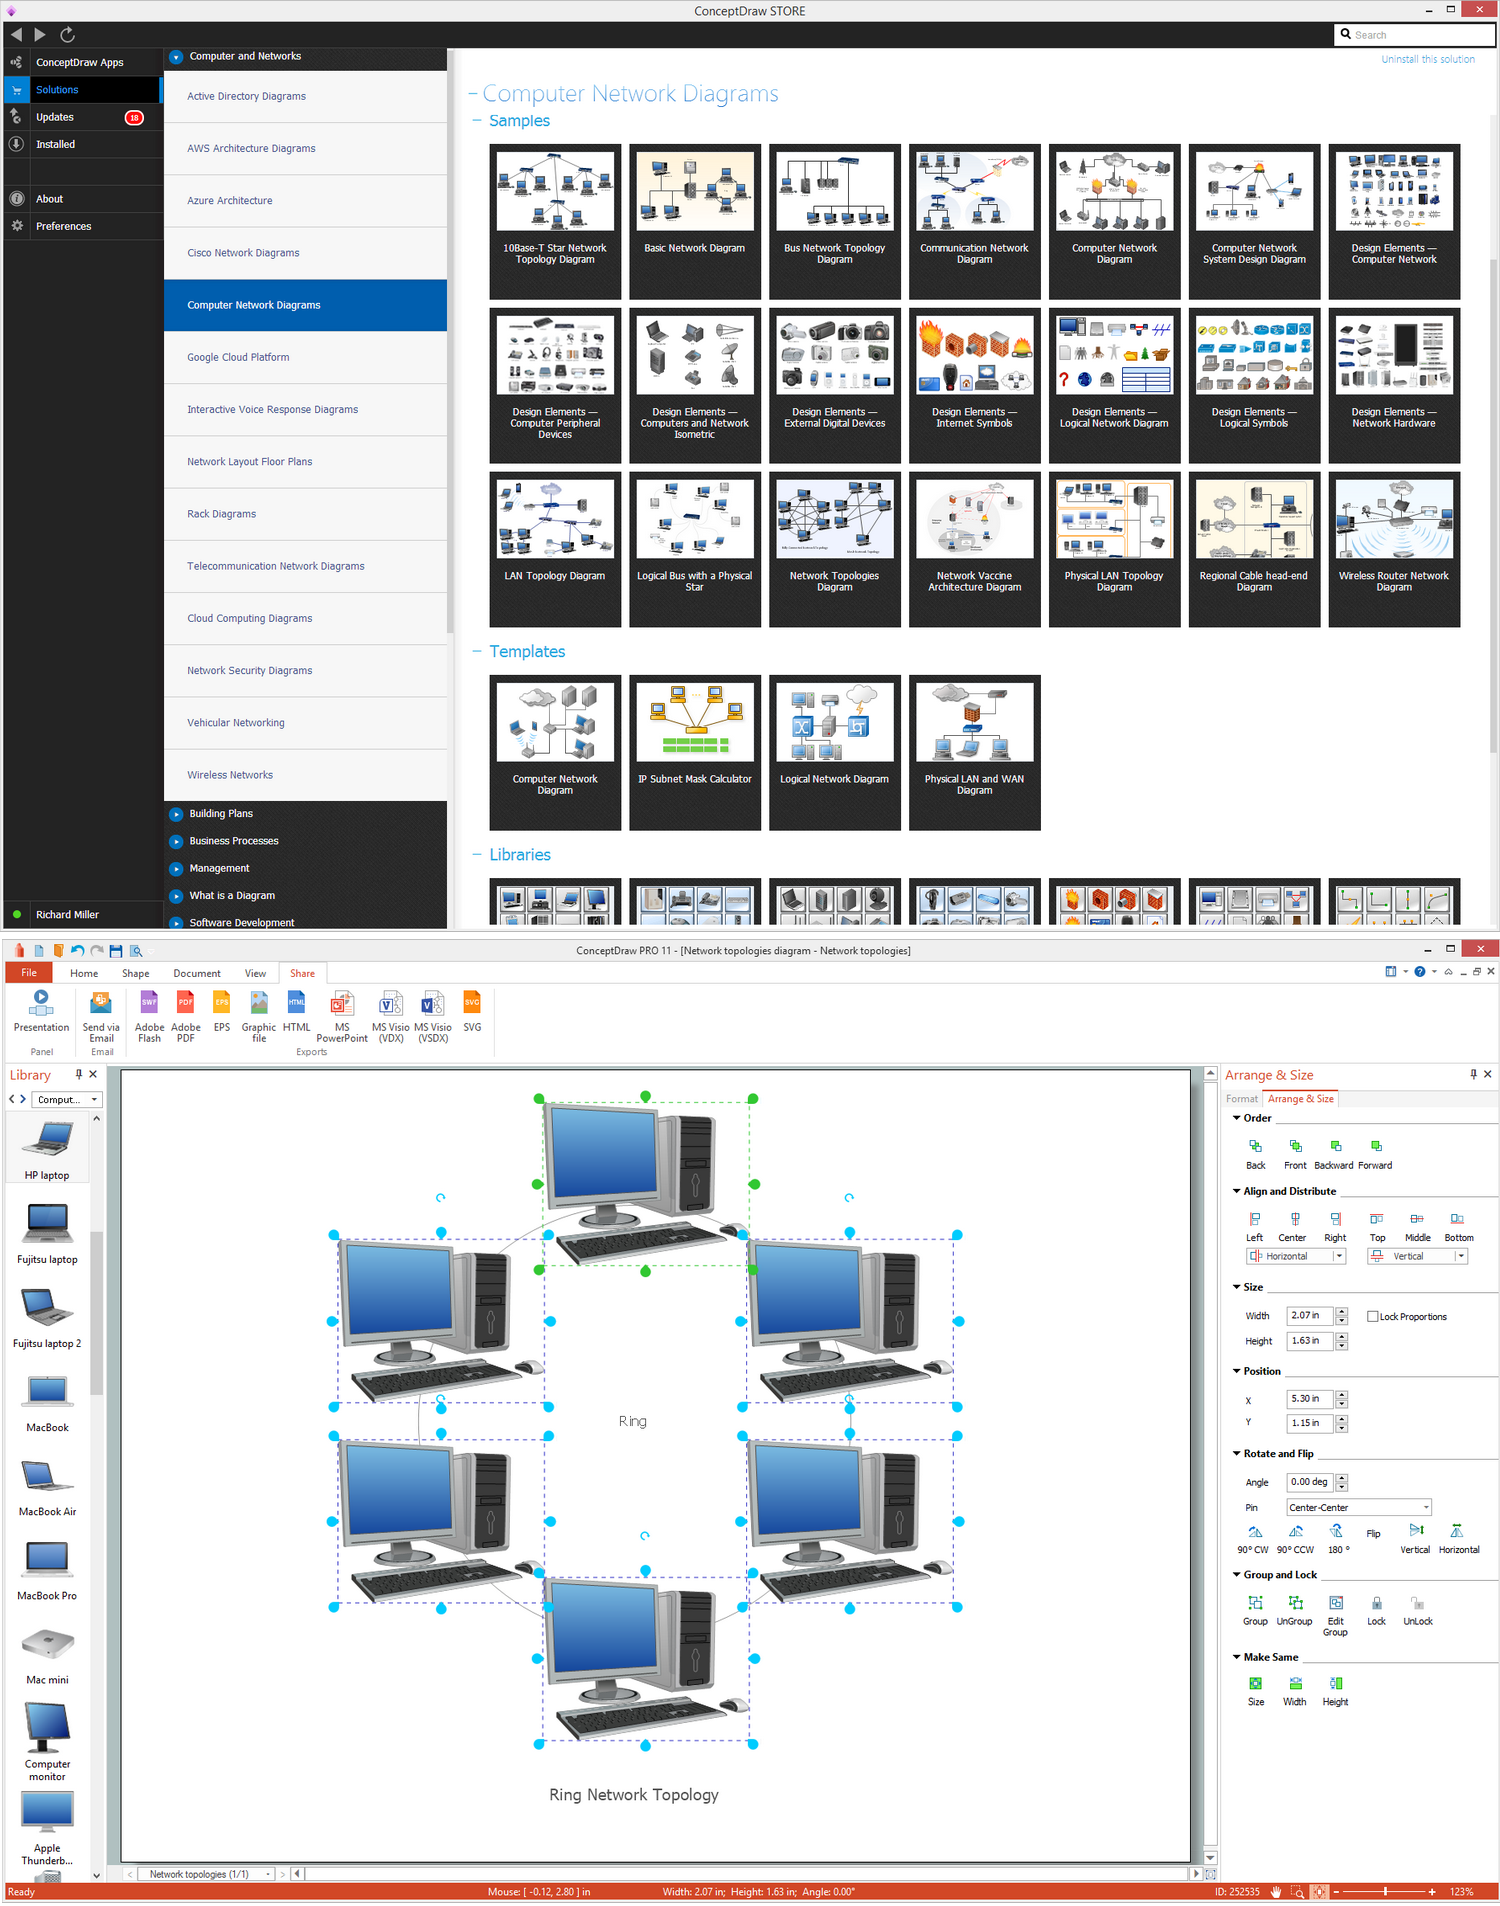
Ring Network Topology
The Ring Network Topology Diagram examples was created using ConceptDraw PRO software with Computer and Networks solution.Vertical Cross Functional Flowchart
ConceptDraw PRO is a powerful tool that helps you create professional looking cross-functional flowcharts with the well-designed objects. ConceptDraw PRO - Drawing Software for Vertical Cross Functional Flowchart. ConceptDraw allows you to focus on work, not the drawing process. ConceptDraw Arrows10 Technology allows to draw connectors with smart behavior that gives flexibility to you during work process.Network Topologies
ConceptDraw PRO is a powerful Network Topology Diagram software thanks to the Computer Network Diagrams Solution from the Computer and Networks Area. It's very easy and quickly to design the network topologies diagrams of any kinds and complexity in ConceptDraw PRO diagramming and vector drawing software.Easy to draw network topology, physical network, logical network, network mapping, home area networks (HAN), wireless network, cisco network topologies, fully connected network topology, bus network topology, star network topology, ring network topology, mesh network topology, tree network topology.

 Directional Maps
Directional Maps solution extends ConceptDraw PRO software with templates, samples and libraries of vector stencils for drawing the directional, location, site, transit, road and route maps, plans and schemes.
 USA Maps
Use the USA Maps solution to create a map of USA, a US interstate map, printable US maps, US maps with cities and US maps with capitals. Create a complete USA states map.
Design Pictorial Infographics. Design Infographics
In the course of recent decades data visualization went through significant development and has become an indispensable tool of journalism, business intelligence and science. The way visual information may be conveyed is not limited simply to static or dynamic representation, it can also be interactive. Infographics can be conditionally divided into several general levels. Primarily, this is level of visualization of information, its interpretation and association on any ground. Second level can be defined as a visualization of knowledge, depiction of thoughts and ideas in the form of images or diagrams. Finally, the level of data visualization, which processes data arrays in charts, enabling the information to be more clearly perceived. You can also identify the main approaches to the creation of infographics: exploratory and narrative. Exploratory method insists on minimalist design in favor of data precision without unnecessary details and is common for scientific researches and ana- Travelling Management Working Diagram
- Data Flow Diagram Of Travel Management System
- How To Create a Workflow Diagram | Dfd For Travel Agency System
- 1 Level Of Dfd For Travel Management System
- Data Flow Diagram For Travel Management System
- System And Context Data Flow Diagram For Travel Management
- Tours And Travels Management System In Dfd Diagram
- Collaboration Diagram For Travel Agency
- Dfd Diagrams For Travel Management System
- Directions Map | Travel Infographics | Infographic Software | Travel ...
- Swimlane Diagram For Travel Management System
- Workflow Diagram For Tours And Travel Management System
- How To Create a Workflow Diagram | Vertical Cross Functional ...
- Vertical Cross Functional Flowchart | Workflow Diagram | How To ...
- Data Flow Diagram Of Sales For Travel Agency
- Explain All Main Process In Dfd Of Travelling Management System
- Workflow Diagram | Cycle of automobile dependency - Circle pie ...
- Dfd Of Tour And Travel Management System
- Draw A Data Flow Diagram Level 1 Of Travel Agent Booking System
- Er Diagram For Travel Management System
- ERD | Entity Relationship Diagrams, ERD Software for Mac and Win
- Flowchart | Basic Flowchart Symbols and Meaning
- Flowchart | Flowchart Design - Symbols, Shapes, Stencils and Icons
- Flowchart | Flow Chart Symbols
- Electrical | Electrical Drawing - Wiring and Circuits Schematics
- Flowchart | Common Flowchart Symbols
- Flowchart | Common Flowchart Symbols


