UML Class Diagram Example for GoodsTransportation System

This sample shows the concept of working of the transport company and is used by transport companies, carriers at the transportation of various goods.
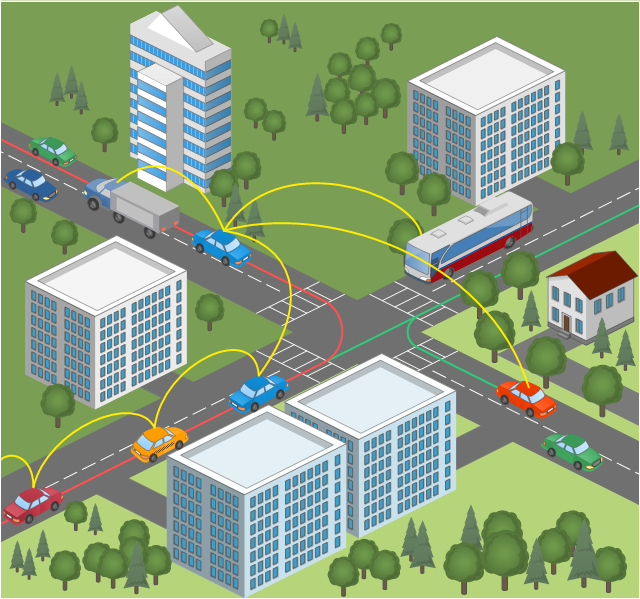
This vehicular network diagram sample was drawn on the base of picture illustrating the post "Intelligent transportation system" from the blog "Technology New Here".
"Intelligent transportation systems are projects that aim to integrate modern communication and information technology into existing transportation management systems in order to optimize vehicle life, fuel efficiency, safety, and traffic in urbanized cities.
The need for intelligent transportation systems stems from the fact that traffic congestion has been increasing all around the world because of increasing population, increasing amount of transportation vehicles and increasing urbanization."
[technologynewhere.wordpress.com/ 2010/ 05/ 12/ intelligent-transportation-system/ ]
The vehicular network diagram example "Intelligent transportation system" was created using the ConceptDraw PRO diagramming and vector drawing software extended with the Vehicular Networking solution from the Computer and Networks area of ConceptDraw Solution Park.
Vehicular network diagram
Used Solutions
 Data Flow Diagrams (DFD)
Data Flow Diagrams solution extends ConceptDraw PRO software with templates, samples and libraries of vector stencils for drawing the data flow diagrams (DFD).
 Fishbone Diagram
Fishbone Diagrams solution extends ConceptDraw PRO software with templates, samples and library of vector stencils for drawing the Ishikawa diagrams for cause and effect analysis.
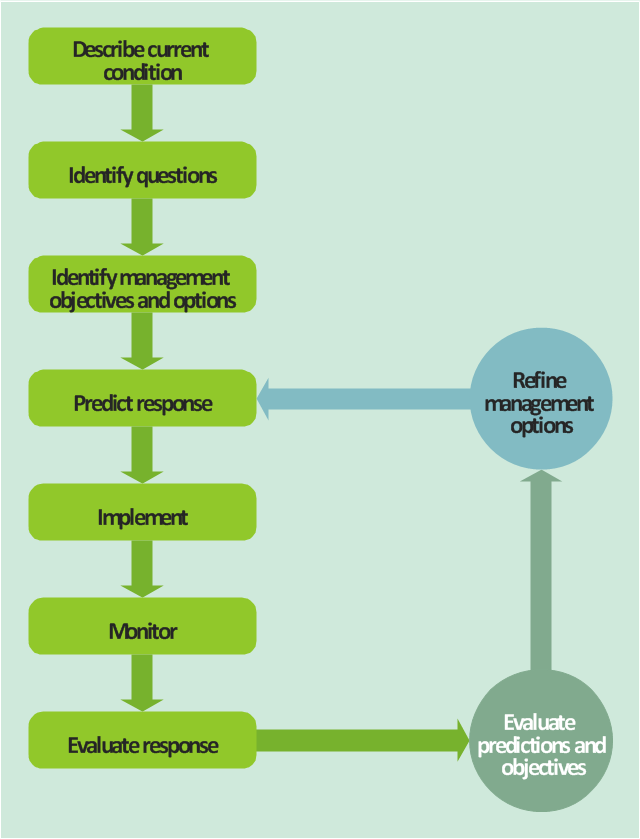
This TQM diagram sample was redesigned from the illustration of "Inland acid sulfate soil and water quality fact sheet" from website of the Department of the Environment of the Australian Government.
[environment.gov.au/ resource/ inland-acid-sulfate-soil-and-water-quality-fact-sheet]
"Adaptive management (AM), also known as adaptive resource management (ARM), is a structured, iterative process of robust decision making in the face of uncertainty, with an aim to reducing uncertainty over time via system monitoring. In this way, decision making simultaneously meets one or more resource management objectives and, either passively or actively, accrues information needed to improve future management. Adaptive management is a tool which should be used not only to change a system, but also to learn about the system (Holling 1978). Because adaptive management is based on a learning process, it improves long-run management outcomes. The challenge in using the adaptive management approach lies in finding the correct balance between gaining knowledge to improve management in the future and achieving the best short-term outcome based on current knowledge (Allan & Stankey 2009)." [Adaptive management. Wikipedia]
The TQM flowchart example "Acid sulfate soil adaptive management framework" was created using the ConceptDraw PRO diagramming and vector drawing software extended with the Total Quality Management (TQM) Diagrams solution from the Quality area of ConceptDraw Solution Park.
TQM diagram
UML Class Diagram Example for Transport System

This sample shows the transport protocol mappings for SNMP (Simple Network Management Protocol), the classes of the transport system and relationships between them and is used in IP network.
"The Process Flow Chart provides a visual representation of the steps in a process. ...
When to Use:
One of the first activities of a process improvement effort is constructing a flowchart. It provides the following benefits:
1- It give you and everyone a clear understanding of the process.
2- Facilitates teamwork and communication.
3- Helps to identify non-value-added operations."
[bexcellence.org/ Flow-Chart.html]
This TQM diagram example shows a business process that can be then analyzed to improve the effectiveness and diagnose quality issues that require resolution.
This example was created using the ConceptDraw PRO diagramming and vector drawing software extended with the Total Quality Management (TQM) Diagrams solution from the Quality area of ConceptDraw Solution Park.
TQM diagram

 Entity-Relationship Diagram (ERD)
An Entity-Relationship Diagram (ERD) is a visual presentation of entities and relationships. That type of diagrams is often used in the semi-structured or unstructured data in databases and information systems. At first glance ERD is similar to a flowch
The vector stencils library "TQM diagrams" contains 58 TQM symbols. Use it in business process re-engineering, total quality management, continuous improvement, and quality solutions to draw cause-and-effect diagrams, top-down, and cross-functional process flow charts in the ConceptDraw PRO diagramming and vector drawing software extended with the Total Quality Management (TQM) Diagrams solution from the Quality area of ConceptDraw Solution Park.
Transportation

Inbound Goods
Storage
Procedure

Operation

Operation/ Inspection

Issue

Organization Function

2-Part Function

Decision 1 (TQM)
-tqm-diagrams---vector-stencils-library.png--diagram-flowchart-example.png)
Decision 2 (TQM)
-tqm-diagrams---vector-stencils-library.png--diagram-flowchart-example.png)
Multi in/out Decision (Multi-Input on right)
-tqm-diagrams---vector-stencils-library.png--diagram-flowchart-example.png)
Multi in/out Decision (Multi-Input on left)
-tqm-diagrams---vector-stencils-library.png--diagram-flowchart-example.png)
External Organization

External Process

Inspection/Measurement

Metric

2-part metric

System Database

System Support

System Function

Delay

Connector (TQM)
-tqm-diagrams---vector-stencils-library.png--diagram-flowchart-example.png)
Off-Page Reference

Connected Issues

Fabrication (black)
-tqm-diagrams---vector-stencils-library.png--diagram-flowchart-example.png)
Fabrication (white)
-tqm-diagrams---vector-stencils-library.png--diagram-flowchart-example.png)
Move (black)
-tqm-diagrams---vector-stencils-library.png--diagram-flowchart-example.png)
Move (white)
-tqm-diagrams---vector-stencils-library.png--diagram-flowchart-example.png)
Store (black)
-tqm-diagrams---vector-stencils-library.png--diagram-flowchart-example.png)
Store (white)
-tqm-diagrams---vector-stencils-library.png--diagram-flowchart-example.png)
Inspection (black)
-tqm-diagrams---vector-stencils-library.png--diagram-flowchart-example.png)
Inspection (white)
-tqm-diagrams---vector-stencils-library.png--diagram-flowchart-example.png)
Selectable Process (All White)
-tqm-diagrams---vector-stencils-library.png--diagram-flowchart-example.png)
Selectable Process ('Fabrication' Black)
-tqm-diagrams---vector-stencils-library.png--diagram-flowchart-example.png)
Selectable Process ('Move' Black)
-tqm-diagrams---vector-stencils-library.png--diagram-flowchart-example.png)
Selectable Process ('Store' Black)
-tqm-diagrams---vector-stencils-library.png--diagram-flowchart-example.png)
Selectable Process ('Inspection' Black)
-tqm-diagrams---vector-stencils-library.png--diagram-flowchart-example.png)
Work Flow Loop 1
Work Flow Loop 2
Feedback Arrow
X-Function - Vertical

X-Function - Horizontal

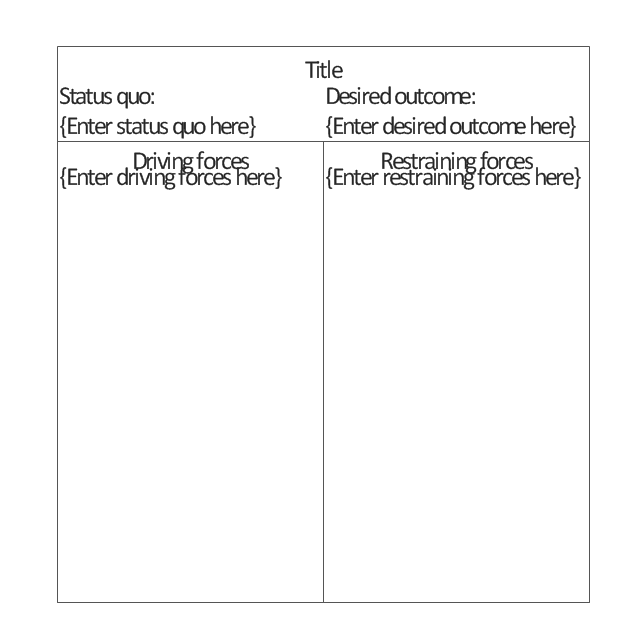
Force-Field Analysis
Cause 1
Cause 2
Cause 3
Category
Effect
Fish Frame

Dynamic Connector
Result
No Result

Branch: Return

Branch: No Return

Interrupt

External Control

Refinement

 Vehicular Networking
The Vehicular Networking solution extends the ConceptDraw PRO software functionality with specialized tools, wide variety of pre-made vector objects, collection of samples and templates in order to help network engineers design vehicular network diagrams for effective network engineering activity, visualize vehicular networks, develop smart transportation systems, design various types of vehicle network management diagrams, regional network diagrams, vehicular communication system diagrams, vehicular ad-hoc networks, vehicular delay-tolerant networks, and other network engineering schemes.
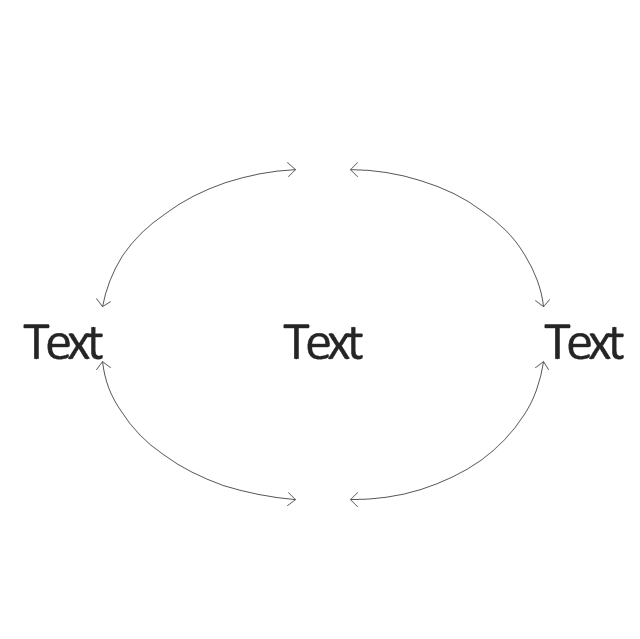
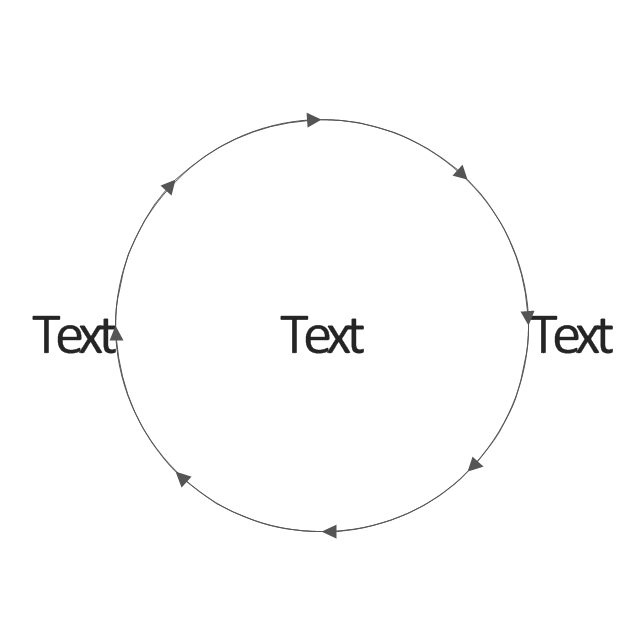
This circle-spoke diagram sample shows how leadership and data provide essential coordination of other functions in an asset management environment. Leadership points the way and common data systems keep all divisions communicating effectively.
This circle-spoke diagram example was created on the base of illustration of article "Beyond the Short Term: Transportation Asset Management for Long-Term Sustainability, Accountability and Performance" from the website of The Federal Highway Administration (FHWA).
[fhwa.dot.gov/ asset/ 10009/ tam_ topr806_ 3.cfm]
"Asset management, broadly defined, refers to any system that monitors and maintains things of value to an entity or group. It may apply to both tangible assets such as buildings and to intangible concepts such as intellectual property and goodwill. Asset management is a systematic process of operating, maintaining, upgrading, and disposing of assets cost-effectively. Alternative views of asset management in the engineering environment are: the practice of managing assets to achieve the greatest return (particularly useful for productive assets such as plant and equipment), and the process of monitoring and maintaining facilities systems, with the objective of providing the best possible service to users (appropriate for public infrastructure assets)." [Asset management. Wikipedia]
The hub-and-spoke diagram example "Leadership and data" was created using the ConceptDraw PRO diagramming and vector drawing software extended with the Circle-Spoke Diagrams solution from the area "What is a Diagram" of ConceptDraw Solution Park.
Circle-spoke diagram

This TQM diagram example was redesigned from the illustration of the Highway Performance Monitoring System (HPMS) Field Manual from the website of the Federal Highway Administration (FHWA).
[fhwa.dot.gov/ policyinformation/ hpms/ fieldmanual/ chapter7.cfm]
"Highway Performance Monitoring System (HPMS).
The HPMS is a national level highway information system that includes data on the extent, condition, performance, use and operating characteristics of the nation's highways. The HPMS contains administrative and extent of system information on all public roads, while information on other characteristics is represented in HPMS as a mix of universe and sample data for arterial and collector functional systems. Limited information on travel and paved miles is included in summary form for the lowest functional systems.
HPMS was developed in 1978 as a continuing database, replacing the special biennial condition studies that had been conducted since 1965. The HPMS has been modified several times since its inception. Changes have been made to reflect changes in the highway systems, legislation, and national priorities, to reflect new technology, and to consolidate or streamline reporting requirements." [fhwa.dot.gov/ policyinformation/ hpms.cfm]
The TQM flowchart example "Software workflow diagram" was created using the ConceptDraw PRO diagramming and vector drawing software extended with the Total Quality Management (TQM) Diagrams solution from the Quality area of ConceptDraw Solution Park.
TQM diagram

Flow chart Example. Warehouse Flowchart

Standard warehousing process flow diagram and standard workflow diagram used for process identification for further evaluating effectiveness and profitability of overall business process. Use the ConceptDraw PRO diagramming and vector drawing software extended with the Flowcharts solution from the Diagrams area of ConceptDraw Solution Park to design your own workflow diagrams, process flow diagram and flow charts. Need to use Process Flow Diagram for designing Warehouse packages flow.

"Classic TQM Tools ...
Flow Charts Pictures, symbols or text coupled with lines, arrows on lines show direction of flow. Flowcharting enables
modeling of processes; problems/ opportunities and decision points etc. It develops a common understanding of a process by those in
volved." [whaqualitycenter.org/ Portals/ 0/ Tools%20 to%20 Use/ Classic%20 Quality%20 Tools/ Classic%20 TQM%20 Tools%20 R%20 2-12.pdf]
The vector stencils library TQM diagrams contains 58 symbols for drawing total quality management (TQM) flow charts using the ConceptDraw PRO diagramming and vector drawing software.
The example "Design elements - TQM diagram" is included in the Total Quality Management (TQM) Diagrams solution from the Quality area of ConceptDraw Solution Park.
TQM flow chart symbols

 Entity-Relationship Diagram (ERD)
Entity-Relationship Diagram (ERD) solution extends ConceptDraw PRO software with templates, samples and libraries of vector stencils from drawing the ER-diagrams by Chen's and crow’s foot notations.
- Transportatiom Management Diagram
- Class Digram Of Transportation Management System
- The Diagram Of Transportation System
- Intelligent transportation system | Transportation Infographics | UML ...
- Intelligent transportation system | An Intelligent Car Park ...
- Transportation Problems Uml Diagrams
- Class Model Design Of Transportation Management System
- Transport Management System For Usecase Diagram
- Transportation Infographics | Rail transport - Design elements ...
- Diagram Of Transportation
- Use Case Diagram For Transportation Management System
- Er Diagram Of Transportation
- Transportation Management System Flow Chart
- Role Of Transportation With Diagram
- Intelligent transportation system | Global vehicular network diagram ...
- Intelligent transportation system | Vehicular Networking | Automatic ...
- Diagram Of Diffferent Means Of Transportation
- UML Deployment Diagram Example - ATM System UML diagrams ...
- Fishbone Diagram | Design elements - Aircraft | HVAC Plans ...
- Transportation System In Database System Er Diagram
- ERD | Entity Relationship Diagrams, ERD Software for Mac and Win
- Flowchart | Basic Flowchart Symbols and Meaning
- Flowchart | Flowchart Design - Symbols, Shapes, Stencils and Icons
- Flowchart | Flow Chart Symbols
- Electrical | Electrical Drawing - Wiring and Circuits Schematics
- Flowchart | Common Flowchart Symbols
- Flowchart | Common Flowchart Symbols