The vector clipart library "Presentation design elements" contains 45 presentation symbols and arrows which you can easy use in your slides and illustrations.
"A presentation is the process of presenting a topic to an audience. It is typically a demonstration, lecture, or speech meant to inform, persuade, or build good will. ... the use of visuals reduced meeting times... audiences believe presenters who use visuals are more professional and credible than presenters who merely speak. ... meetings and presentations reinforced with visuals help participants reach decisions and consensus more quickly." [Presentation. Wikipedia]
The clip art example "Presentation design elements - Vector clipart library" was created in the ConceptDraw PRO diagramming and vector drawing software using the Presentation Clipart solution from the Illustration area of ConceptDraw Solution Park.
Advance Direction Sign

Circuit

Growth

Master Link

Comparison

Plus

Minus

Multiplication

Division

Loupe

Plus sign

Minus sign

Pros and Cons

Balance Lever

Balance

Scientific Research

Business People

Hand

Financial Growth

Wallet

Increase

Decrease

Clock

Mechanism

Interaction

Small Company

Big Company

Company Expansion

Foreign Market Entry

Time

Close Cooperation

Company

Company Merger

Company Extension

Foreign Market Penetration

Business Relations

Profits

Frame 1

Frame 2

Background 1

Background 2

Background 3

Background 4

Background 5

Title block

Marketing Plan Infographic

Flow Chart Symbols

The healthcare management infographics example "Confirmed cases of swine flu in Australia" was redesigned from the Wikimedia Commons file: H1N1 Australia Confirmed Map.svg.
[commons.wikimedia.org/ wiki/ File:H1N1_ Australia_ Confirmed_ Map.svg]
"Swine influenza, also called pig influenza, swine flu, hog flu and pig flu, is an infection caused by any one of several types of swine influenza viruses. Swine influenza virus (SIV) or swine-origin influenza virus (S-OIV) is any strain of the influenza family of viruses that is endemic in pigs. As of 2009, the known SIV strains include influenza C and the subtypes of influenza A known as H1N1, H1N2, H2N1, H3N1, H3N2, and H2N3.
Swine influenza virus is common throughout pig populations worldwide. Transmission of the virus from pigs to humans is not common and does not always lead to human flu, often resulting only in the production of antibodies in the blood. If transmission does cause human flu, it is called zoonotic swine flu. People with regular exposure to pigs are at increased risk of swine flu infection.
Around the mid-20th century, identification of influenza subtypes became possible, allowing accurate diagnosis of transmission to humans. Since then, only 50 such transmissions have been confirmed. These strains of swine flu rarely pass from human to human. Symptoms of zoonotic swine flu in humans are similar to those of influenza and of influenza-like illness in general, namely chills, fever, sore throat, muscle pains, severe headache, coughing, weakness and general discomfort." [Swine influenza
From Wikipedia]
The thematic map example "Confirmed cases of swine flu in Australia" was created using the ConceptDraw PRO diagramming and vector drawing software extended with the Management Infographics solition from the area "Business Infographics" in ConceptDraw Solution Park.
Australia thematic map example

Make an Infographic

The vector clipart library "Presentation design elements" contains 45 presentation symbols and arrows which you can easy use in your slides and illustrations.
"A presentation is the process of presenting a topic to an audience. It is typically a demonstration, lecture, or speech meant to inform, persuade, or build good will. ... the use of visuals reduced meeting times... audiences believe presenters who use visuals are more professional and credible than presenters who merely speak. ... meetings and presentations reinforced with visuals help participants reach decisions and consensus more quickly." [Presentation. Wikipedia]
The clip art example "Presentation design elements - Vector clipart library" was created in the ConceptDraw PRO diagramming and vector drawing software using the Presentation Clipart solution from the Illustration area of ConceptDraw Solution Park.
"A presentation is the process of presenting a topic to an audience. It is typically a demonstration, lecture, or speech meant to inform, persuade, or build good will. ... the use of visuals reduced meeting times... audiences believe presenters who use visuals are more professional and credible than presenters who merely speak. ... meetings and presentations reinforced with visuals help participants reach decisions and consensus more quickly." [Presentation. Wikipedia]
The clip art example "Presentation design elements - Vector clipart library" was created in the ConceptDraw PRO diagramming and vector drawing software using the Presentation Clipart solution from the Illustration area of ConceptDraw Solution Park.
Advance Direction Sign
Circuit
Growth
Master Link
Comparison
Plus
Minus
Multiplication
Division
Loupe
Plus sign
Minus sign
Pros and Cons
Balance Lever
Balance
Scientific Research
Business People
Hand
Financial Growth
Wallet
Increase
Decrease
Clock
Mechanism
Interaction
Small Company
Big Company
Company Expansion
Foreign Market Entry
Time
Close Cooperation
Company
Company Merger
Company Extension
Foreign Market Penetration
Business Relations
Profits
Frame 1
Frame 2
Background 1
Background 2
Background 3
Background 4
Background 5
Title block
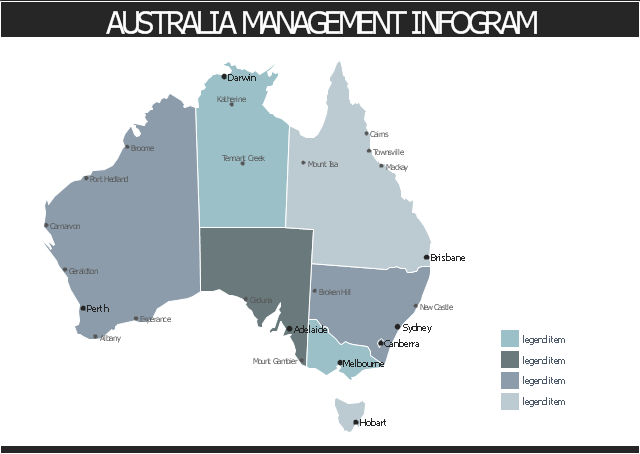
This thematic map template shows contours of Australia states and territories with capitals and major cities.
Use it to design your management infograms using the ConceptDraw PRO diagramming and vector drawing software.
The template "Australia management infogram" is included in the Management infographics solution from the Business infographics area of ConceptDraw Solution Park.
Use it to design your management infograms using the ConceptDraw PRO diagramming and vector drawing software.
The template "Australia management infogram" is included in the Management infographics solution from the Business infographics area of ConceptDraw Solution Park.
Australia thematic map template
Telecommunications Network

Constellation Chart

Astronomy solution contains 4 libraries with vector objects of all variety of constellations: Constellations Except Zodiac Northern and Southern, Northern Constellations, Southern Constellations and Zodiac Constellations.
Chemistry Symbols and Meanings

EPC Engineering

The vector stencils library "Menus" contains 14 icons of Windows 8 menus.
Use this menu UI icon set to design graphic user interface (GUI) prototypes of your software applications for Windows 8.
"A menu bar is a graphical control element which contains drop down menus. The menu bar's purpose is to supply a common housing for window- or application-specific menus which provide access to such functions as opening files, interacting with an application, or displaying help documentation or manuals. Menu bars are typically present in graphical user interfaces that display documents and representations of files in windows and windowing systems but menus can be used as well in command line interface programs like text editors or filemanagers where drop-down menu is activated with shortcut key or combination. ...
The menu bar in Microsoft Windows is usually anchored to the top of a window under the title bar; therefore, there can be many menu bars on screen at one time. Menus in the menu bar can be accessed through shortcuts involving the Alt key and the mnemonic letter that appears underlined in the menu title. Additionally, pressing Alt or F10 brings the focus on the first menu of the menu bar." [Menu bar. Wikipedia]
The menu elements example "Menus - Vector stencils library" was created using the ConceptDraw PRO diagramming and vector drawing software extended with the Windows 8 User Interface solution from the Software Development area of ConceptDraw Solution Park.
Menu bar
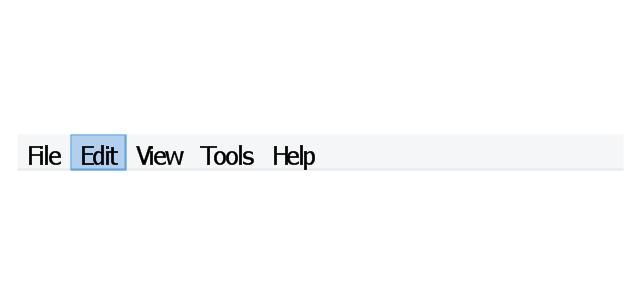
Menu category

Menu category - selected

Menu bar background

Drop-down menu
Separator line

Check

Option

Menu item

Menu item - selected
Menu item - disabled

Arrow indicator
Menu item with arrow
Menu item with arrow - selected
Baseball Diagram – Defensive Fly Ball

Education Information

Education Infographics

- Title Background Design Presentation Png
- Design For Title Png
- Id Card Background
- Background Design Png
- How to Add Different Backgrounds Within a Multipage Drawing
- Png Background Designs
- Corporate Id Card Background
- Vector Background Png
- Blue Wedding Background Design Png
- Plus Minus Multiply Divide Background Png Hd
- Frames Design Png
- Clipart Background Designs Png
- Png Title
- School Text Background Vector Png
- Plus Design Png
- How to Add Different Backgrounds Within a Multipage Drawing
- Id Card Design Background Png
- Title Rectangle Png
- Vector Line Black Background Png
- Financial Growth Png
- ERD | Entity Relationship Diagrams, ERD Software for Mac and Win
- Flowchart | Basic Flowchart Symbols and Meaning
- Flowchart | Flowchart Design - Symbols, Shapes, Stencils and Icons
- Flowchart | Flow Chart Symbols
- Electrical | Electrical Drawing - Wiring and Circuits Schematics
- Flowchart | Common Flowchart Symbols
- Flowchart | Common Flowchart Symbols