The vector stencils library "Time" contains 20 time and clock icons.
Use it to design your business and finance illustrations and infographics with ConceptDraw PRO diagramming and vector drawing software.
"Time management is the act or process of planning and exercising conscious control over the amount of time spent on specific activities, especially to increase effectiveness, efficiency or productivity.
It is a meta-activity with the goal to maximize the overall benefit of a set of other activities within the boundary condition of a limited amount of time.
Time management may be aided by a range of skills, tools, and techniques used to manage time when accomplishing specific tasks, projects, and goals complying with a due date." [Time management. Wikipedia]
The icon set example "Design elements - Time" is included in the Business and Finance solution from Illustration area of ConceptDraw Solution Park.
Icon set
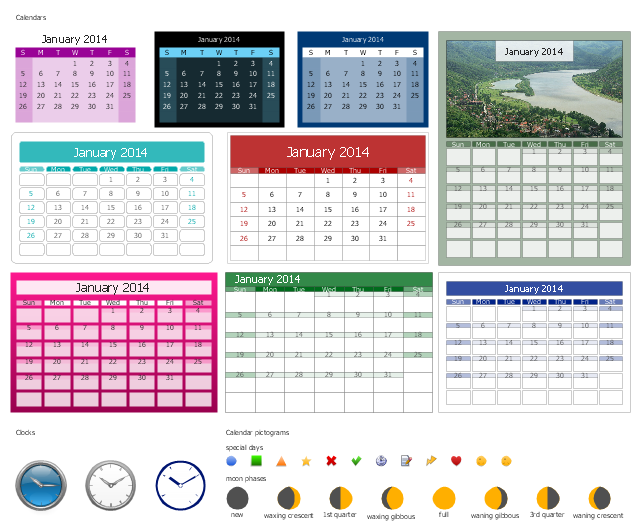
The vector stencils library "Calendars" contains 44 month calendars templates, marker icons and symbols for schedules, and clock clipart. Use it for creating the business calendars and time management infographics using the ConceptDraw PRO diagramming and vector drawing software.
"Time management is the act or process of planning and exercising conscious control over the amount of time spent on specific activities, especially to increase effectiveness, efficiency or productivity.
It is a meta - activity with the goal to maximize the overall benefit of a set of other activities within the boundary condition of a limited amount of time.
Time management may be aided by a range of skills, tools, and techniques used to manage time when accomplishing specific tasks, projects, and goals complying with a due date. Initially, time management referred to just business or work activities, but eventually the term broadened to include personal activities as well. A time management system is a designed combination of processes, tools, techniques, and methods. Time management is usually a necessity in any project development as it determines the project completion time and scope." [Time management. Wikipedia]
The example "Design elements - Calendars" is included in the Calendars solution from the Management area of ConceptDraw Solution Park.
Calendars and clocks
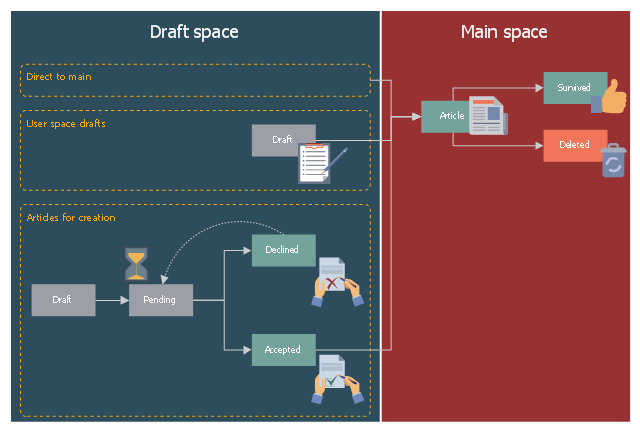
This workflow diagram example was designed on the base of Wikimedia Commons file: Article creation workflows (enwiki).svg.
"Article creation process workflows for English Wikipedia are presented as a directed graph and split into "draft space" and "main space"." [commons.wikimedia.org/ wiki/ File:Article_ creation_ workflows_ %28enwiki%29.svg]
This file is licensed under the Creative Commons Attribution-Share Alike 4.0 International license. [creativecommons.org/ licenses/ by-sa/ 4.0/ deed.en]
"An encyclopedia or encyclopaedia (also spelled encyclopædia, see spelling differences) is a type of reference work or compendium holding a comprehensive summary of information from either all branches of knowledge or a particular branch of knowledge. Encyclopedias are divided into articles or entries, which are usually accessed alphabetically by article name. Encyclopedia entries are longer and more detailed than those in most dictionaries. Generally speaking, unlike dictionary entries, which focus on linguistic information about words, encyclopedia articles focus on factual information concerning the subject for which the article is named." [Encyclopedia. Wikipedia]
The workflow diagram example "Article creation process workflows" was created using ConceptDraw PRO software extended with the Business Process Workflow Diagrams solution from the Business Processes area of ConceptDraw Solution Park.
Workflow diagram
The vector stencils library "Workflow management" contains 22 icons.
Use it to design your business process workflow diagrams with ConceptDraw PRO software.
"Management in businesses and organizations is the function that coordinates the efforts of people to accomplish goals and objectives by using available resources efficiently and effectively.
Management includes planning, organizing, staffing, leading or directing, and controlling an organization to accomplish the goal or target. Resourcing encompasses the deployment and manipulation of human resources, financial resources, technological resources, and natural resources." [Management. Wikipedia]
The icons example "Design elements - Workflow management" is included in the Business Process Workflow Diagrams solution from the Business Processes area of ConceptDraw Solution Park.
Management icons
Time - Design Elements

"Time management is the .. process of planning and exercising conscious control over the amount of time spent on specific activities, especially to increase effectiveness, efficiency or productivity. Time management may be aided by a range of skills, tools, and techniques used to manage time when accomplishing specific tasks, projects, and goals complying with a due date. Initially, time management referred to just business or work activities, but eventually the term broadened to include personal activities as well. A time management system is a designed combination of processes, tools, techniques, and methods. Time management is usually a necessity in any project development as it determines the project completion time and scope." [Time management. Wikipedia]
This timetable pie chart shows the plan of daily actions and its durations in minutes.
It is useful visual tool of personal time management.
This schedule pie chart example was created using the ConceptDraw PRO diagramming and vector drawing software extended with the Target and Circular Diagrams solution from the Marketing area of ConceptDraw Solution Park.
www.conceptdraw.com/ solution-park/ marketing-target-and-circular-diagrams
Daily activities pie chart

 Calendars
Calendars solution extends ConceptDraw PRO software with templates, samples and library of vector stencils for drawing the business calendars and schedules.
How to Draw Pictorial Chart. How to Use Infograms

Pictorial Infographics solution contains large number of libraries with variety of predesigned vector pictograms that allows you design infographics in minutes. There are available 10 libraries with 197 vector pictograms.
Design Pictorial Infographics. Design Infographics

Basic Flowchart Symbols and Meaning


- Time Management Example Clock
- Example Of Project Time Management
- Time - Vector stencils library | Time - Design Elements | Design ...
- Examples Of Time Management C
- Pyramid Diagram | Time - Vector stencils library | Time and clock ...
- Time and clock pictograms - Vector stencils library | Design ...
- Daily Time Management Clock
- Time - Vector stencils library | Time - Vector stencils library | Time ...
- Strategy Clock Template | iPhone OS (iOS) graphic user interface ...
- Time and clock pictograms - Vector stencils library | Design ...
- ERD | Entity Relationship Diagrams, ERD Software for Mac and Win
- Flowchart | Basic Flowchart Symbols and Meaning
- Flowchart | Flowchart Design - Symbols, Shapes, Stencils and Icons
- Flowchart | Flow Chart Symbols
- Electrical | Electrical Drawing - Wiring and Circuits Schematics
- Flowchart | Common Flowchart Symbols
- Flowchart | Common Flowchart Symbols