Project Timeline

You need to make professional looking project timeline? Create it with ConceptDraw PRO! ConceptDraw PRO extended with Timeline Diagrams Solution from the Management Area is the best timeline diagrams software
Timeline Examples

How to Make a Timeline

Timeline Diagrams

ConceptDraw PRO extended with Timeline Diagrams solution from the Management area of ConceptDraw Solution Park is a powerful software for fast and easy drawing useful and great-looking timeline diagrams.
 Timeline Diagrams
Timeline Diagrams solution extends ConceptDraw PRO software with templates, samples and library of vector stencils for drawing the timeline and milestones diagrams.
HelpDesk
How to Create a Timeline Diagram in ConceptDraw PRO

 Business Processes
Business Process solution extends ConceptDraw PRO software with business process diagrams as cross-functional flowcharts, workflows, process charts, IDEF0, timelines, calendars, Gantt charts, business process modeling, audit and opportunity flowcharts.
 Marketing
This solution extends ConceptDraw PRO v9 and ConceptDraw MINDMAP v7 with Marketing Diagrams and Mind Maps (brainstorming, preparing and holding meetings and presentations, sales calls).
 Quality
This solution extends ConceptDraw PRO v9 and ConceptDraw MINDMAP v7 with Quality Management Diagrams (Total Quality Management Diagrams, Timelines, Workflows, Value Stream Maps) and Mind Maps (Presentations, Meeting Agendas, Problem to be solved).
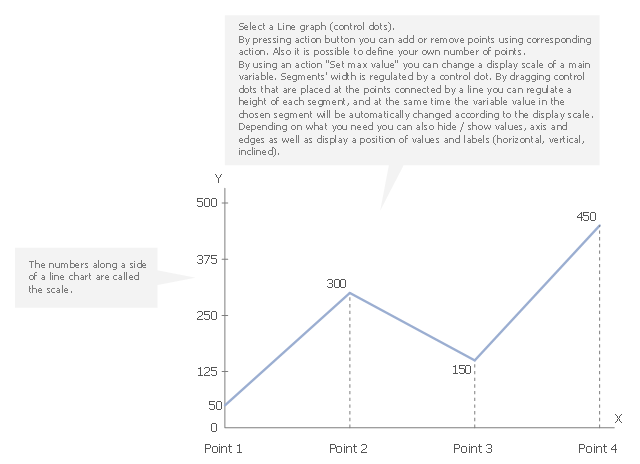
This line graph templates shows the number of tourists visiting the resort town for six months. Use it to design your time series line charts in ConceptDraw PRO diagramming and vector drawing software.
"A time series is a sequence of data points, measured typically at successive points in time spaced at uniform time intervals. ... Time series are very frequently plotted via line charts. Time series are used in statistics, signal processing, pattern recognition, econometrics, mathematical finance, weather forecasting, earthquake prediction, electroencephalography, control engineering, astronomy, and communications engineering. Time series analysis comprises methods for analyzing time series data in order to extract meaningful statistics and other characteristics of the data. Time series forecasting is the use of a model to predict future values based on previously observed values. While regression analysis is often employed in such a way as to test theories that the current values of one or more independent time series affect the current value of another time series, this type of analysis of time series is not called "time series analysis", which focuses on comparing values of time series at different points in time. Time series data have a natural temporal ordering." [Time series. Wikipedia]
The chart template "Line graph" is included in the Basic Line Graphs solution from the Graphs and Charts area of ConceptDraw Solution Park.
Chart template
Stakeholder Onion Diagram Template

 Management
This solution extends ConceptDraw PRO v9 and ConceptDraw MINDMAP v7 with Management Diagrams and Mind Maps (decision making, scheduling, thinking ideas, problem solving, business planning, company organizing, SWOT analysis, preparing and holding meetings
Line Chart Template for Word

This sample shows the Line Chart of annual percentage change. The Line Chart allows you to clearly see the changes of data over the time.
Chart Maker for Presentations

Line Chart Examples

- Timeline - Template | Project Timeline | Timeline Examples ...
- Project Timeline Templates
- Visio Timeline Templates
- Project Timeline | Table Seating Chart Template | Stakeholder Onion ...
- Timeline Examples | How to Make a Timeline | Project Timeline ...
- Timeline Examples | How to Make a Timeline | Project Timeline ...
- Timeline Diagrams | Timeline - Template | Timeline diagram | How ...
- Timeline - Template | Marketing | Management | A Timeline Template
- Timeline Template For Word
- Easy Timeline Template Downloads
- Project Timeline Template Free Download
- Project Timeline | Stakeholder Onion Diagram Template | Process ...
- Free Timeline Template For Microsoft Word
- Timeline Template Visio
- Project Timeline | Stakeholder Onion Diagram Template | Timeline ...
- Timeline - Template | Timeline - Template | Marketing | Timeline ...
- Timeline template | What is Infographics Area | Concise Project ...
- How to Create a Timeline Diagram in ConceptDraw PRO | How to ...
- Picture Timeline Template
- Timeline Template Powerpoint Free Download
- ERD | Entity Relationship Diagrams, ERD Software for Mac and Win
- Flowchart | Basic Flowchart Symbols and Meaning
- Flowchart | Flowchart Design - Symbols, Shapes, Stencils and Icons
- Flowchart | Flow Chart Symbols
- Electrical | Electrical Drawing - Wiring and Circuits Schematics
- Flowchart | Common Flowchart Symbols
- Flowchart | Common Flowchart Symbols