Pyramid Diagram

Basic Flowchart Symbols and Meaning


Pyramid Diagram

ERD Symbols and Meanings

The Chen's ERD notation is still used and is considered to present a more detailed way of representing entities and relationships.
To create an ERD, software engineers mainly turn to dedicated drawing software, which contain the full notation resources for their specific database design - ERD symbols and meanings. CS Odessa has released an all-inclusive Entity-Relationship Diagram (ERD) solution for their powerful drawing program, ConceptDraw PRO.

3 Circle Venn Diagram. Venn Diagram Example

Venn Diagrams visualize all possible logical intersections between several sets and are widely used in mathematics, logic, statistics, marketing, sociology, etc.
Cause and Effect Fishbone Diagram

Now the problem of complexity the Cause and Effect Fishbone Diagram creating is solved thanks to the ConceptDraw PRO diagramming and vector drawing software extended with Fishbone Diagrams solution from the Management area.
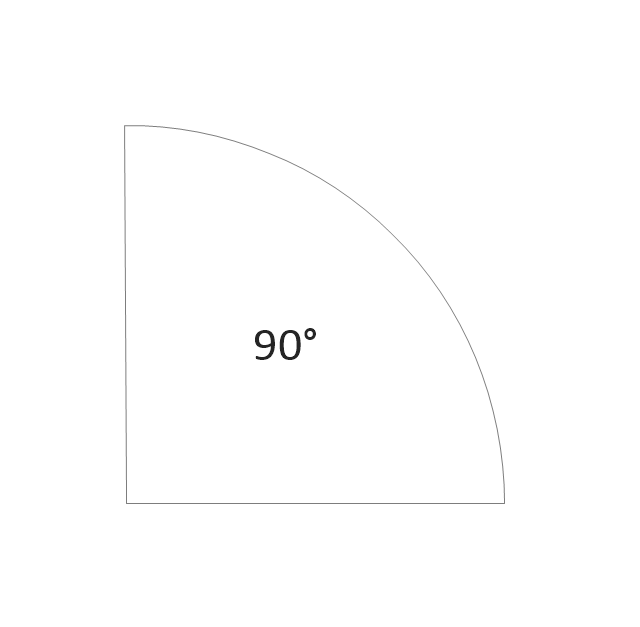
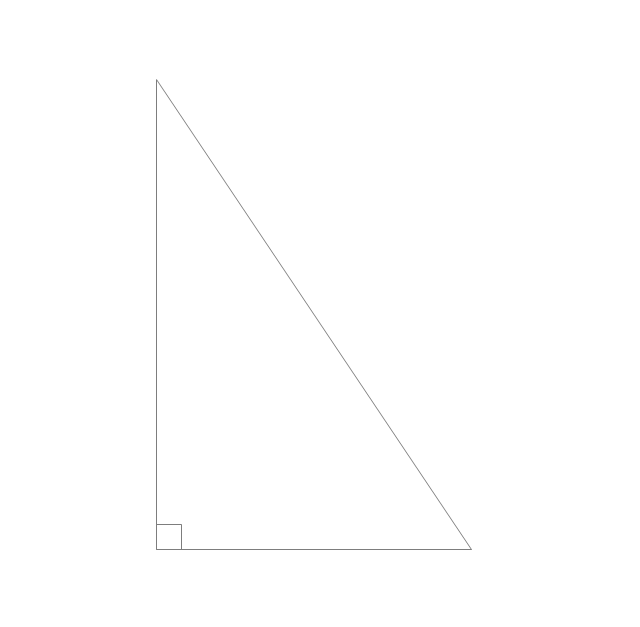
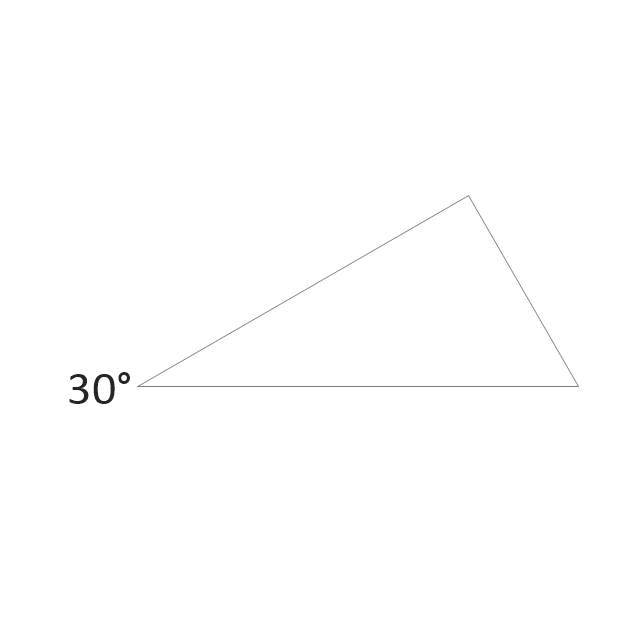
The vector stencils library "Plane geometry" contains 27 plane geometric figures.
Use these shapes to draw your geometrical diagrams and illustrations in the ConceptDraw PRO diagramming and vector drawing software extended with the Mathematics solution from the Science and Education area of ConceptDraw Solution Park.
Use these shapes to draw your geometrical diagrams and illustrations in the ConceptDraw PRO diagramming and vector drawing software extended with the Mathematics solution from the Science and Education area of ConceptDraw Solution Park.
Circular sector
Right triangle

Rectangle

Square

Pentagon

Isosceles trapezium

Parallelogram

Trapezium

Three-pointed star

Four-pointed star

Five-pointed star

Six-pointed star

Seven-pointed star

Eight-pointed star

Triangle

Equilateral triangle

Right triangle 2

Right triangle, angle box
Right triangle 3
Hexagon

Regular hexagon

Regular pentagon

Regular heptagon

Regular octagon

Rhombus

Circle

Ellipse

Entity Relationship Diagram Symbols

ERD symbols used for professional ERD drawing are collected in libraries from the Entity-Relationship Diagram (ERD) solution for ConceptDraw PRO.
Electrical Symbols — Transformers and Windings

26 libraries of the Electrical Engineering Solution of ConceptDraw PRO make your electrical diagramming simple, efficient, and effective. You can simply and quickly drop the ready-to-use objects from libraries into your document to create the electrical diagram.
Process Mapping

- 4 Level pyramid model diagram - Information systems types ...
- Pyramid Diagram
- Pyramid Diagram | Project triangle chart | Pyramid Charts | Building ...
- 3 -Level 3D pyramid diagram - Template
- Pyramid Diagram | Project triangle chart | Pyramid Charts | Chart Of ...
- Chart For Triangular Pyramid
- Levels Of Organization Triangle
- Triangular Venn diagram - Template | Pyramid Diagram | Pyramid ...
- Energy Triangle Pyramid
- Triangle chart - Template | Pyramid diagrams - Vector stencils library ...
- ERD | Entity Relationship Diagrams, ERD Software for Mac and Win
- Flowchart | Basic Flowchart Symbols and Meaning
- Flowchart | Flowchart Design - Symbols, Shapes, Stencils and Icons
- Flowchart | Flow Chart Symbols
- Electrical | Electrical Drawing - Wiring and Circuits Schematics
- Flowchart | Common Flowchart Symbols
- Flowchart | Common Flowchart Symbols