This work flow chart sample was redesigned from the picture "Weather Forecast" from the article "Simulation Workflows".
[iaas.uni-stuttgart.de/ forschung/ projects/ simtech/ sim-workflows.php]
"(1) The weather is predicted for a particular geological area. Hence, the workflow is fed with a model of the geophysical environment of ground, air and water for a requested area.
(2) Over a specified period of time (e.g. 6 hours) several different variables are measured and observed. Ground stations, ships, airplanes, weather balloons, satellites and buoys measure the air pressure, air/ water temperature, wind velocity, air humidity, vertical temperature profiles, cloud velocity, rain fall, and more.
(3) This data needs to be collected from the different sources and stored for later access.
(4) The collected data is analyzed and transformed into a common format (e.g. Fahrenheit to Celsius scale). The normalized values are used to create the current state of the atmosphere.
(5) Then, a numerical weather forecast is made based on mathematical-physical models (e.g. GFS - Global Forecast System, UKMO - United Kingdom MOdel, GME - global model of Deutscher Wetterdienst). The environmental area needs to be discretized beforehand using grid cells. The physical parameters measured in Step 2 are exposed in 3D space as timely function. This leads to a system of partial differential equations reflecting the physical relations that is solved numerically.
(6) The results of the numerical models are complemented with a statistical interpretation (e.g. with MOS - Model-Output-Statistics). That means the forecast result of the numerical models is compared to statistical weather data. Known forecast failures are corrected.
(7) The numerical post-processing is done with DMO (Direct Model Output): the numerical results are interpolated for specific geological locations.
(8) Additionally, a statistical post-processing step removes failures of measuring devices (e.g. using KALMAN filters).
(9) The statistical interpretation and the numerical results are then observed and interpreted by meteorologists based on their subjective experiences.
(10) Finally, the weather forecast is visualized and presented to interested people." [iaas.uni-stuttgart.de/ forschung/ projects/ simtech/ sim-workflows.php]
The example "Workflow diagram - Weather forecast" was drawn using the ConceptDraw PRO diagramming and vector drawing software extended with the Workflow Diagrams solution from the Business Processes area of ConceptDraw Solution Park.
Work flow chart

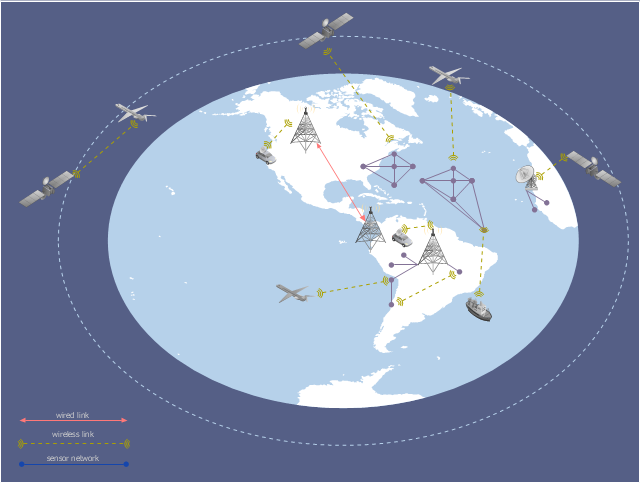
This global vehicular network diagram sample represents the independent regional telematics network.
"Telematics typically is any integrated use of telecommunications and informatics, also known as ICT (Information and Communications Technology). Hence the application of telematics is with any of the following:
(1) The technology of sending, receiving and storing information via telecommunication devices in conjunction with affecting control on remote objects.
(2) The integrated use of telecommunications and informatics, for application in vehicles and with control of vehicles on the move.
(3) Telematics includes but is not limited to Global Positioning System technology integrated with computers and mobile communications technology in automotive navigation systems. ...
Practical applications of vehicle telematics:
1. Vehicle tracking is a way of monitoring the location, movements, status and behaviour of a vehicle or fleet of vehicles. ...
2. Trailer tracking is the technology of tracking the movements and position of an articulated vehicle's trailer unit...
3. Container tracking. Freight containers can be tracked by GPS...
4. Cold store freight trailers ... used to deliver fresh or frozen foods are ... incorporating telematics to gather time-series data on the temperature inside the cargo container...
5. Fleet management includes the management of ships and or motor vehicles such as cars, vans and trucks. Fleet ... Management can include ... vehicle telematics (tracking and diagnostics)...
6. Satellite navigation in the context of vehicle telematics is the technology of using a GPS and electronic mapping tool to enable the driver of a vehicle to locate a position, plan a route and navigate a journey.
7. Mobile data is the use of wireless data communications using radio waves to send and receive real time computer data to, from and between devices used by field based personnel. ...
8. Wireless vehicle safety communications telematics aid in car safety and road safety. ...
9. Emergency warning system for vehicles. Telematics ... are self-orientating open network architecture structures of variable programmable intelligent beacons ... to accord ... warning information with surrounding vehicles in the vicinity of travel, intra-vehicle, and infrastructure. ...
10. Intelligent vehicle technologies. Telematics comprise electronic ... devices ... to provide precision repeatability functions ... emergency warning validation performance reconstruction. ...
11. Car clubs. Telematics-enabled computers allow organizers to track members' usage and bill them on a pay-as-you-drive basis. ...
12. Auto insurance. The basic idea of telematic auto insurance is that a driver's behavior is monitored directly while the person drives and this information is transmitted to an insurance company." [Telematics. Wikipedia]
The example "Independent regional networks diagram" was created using the ConceptDraw PRO diagramming and vector drawing software extended with the Vehicular Networking solution from the Computer and Networks area of ConceptDraw Solution Park.
Global vehicular network diagram
Watercraft - Design Elements
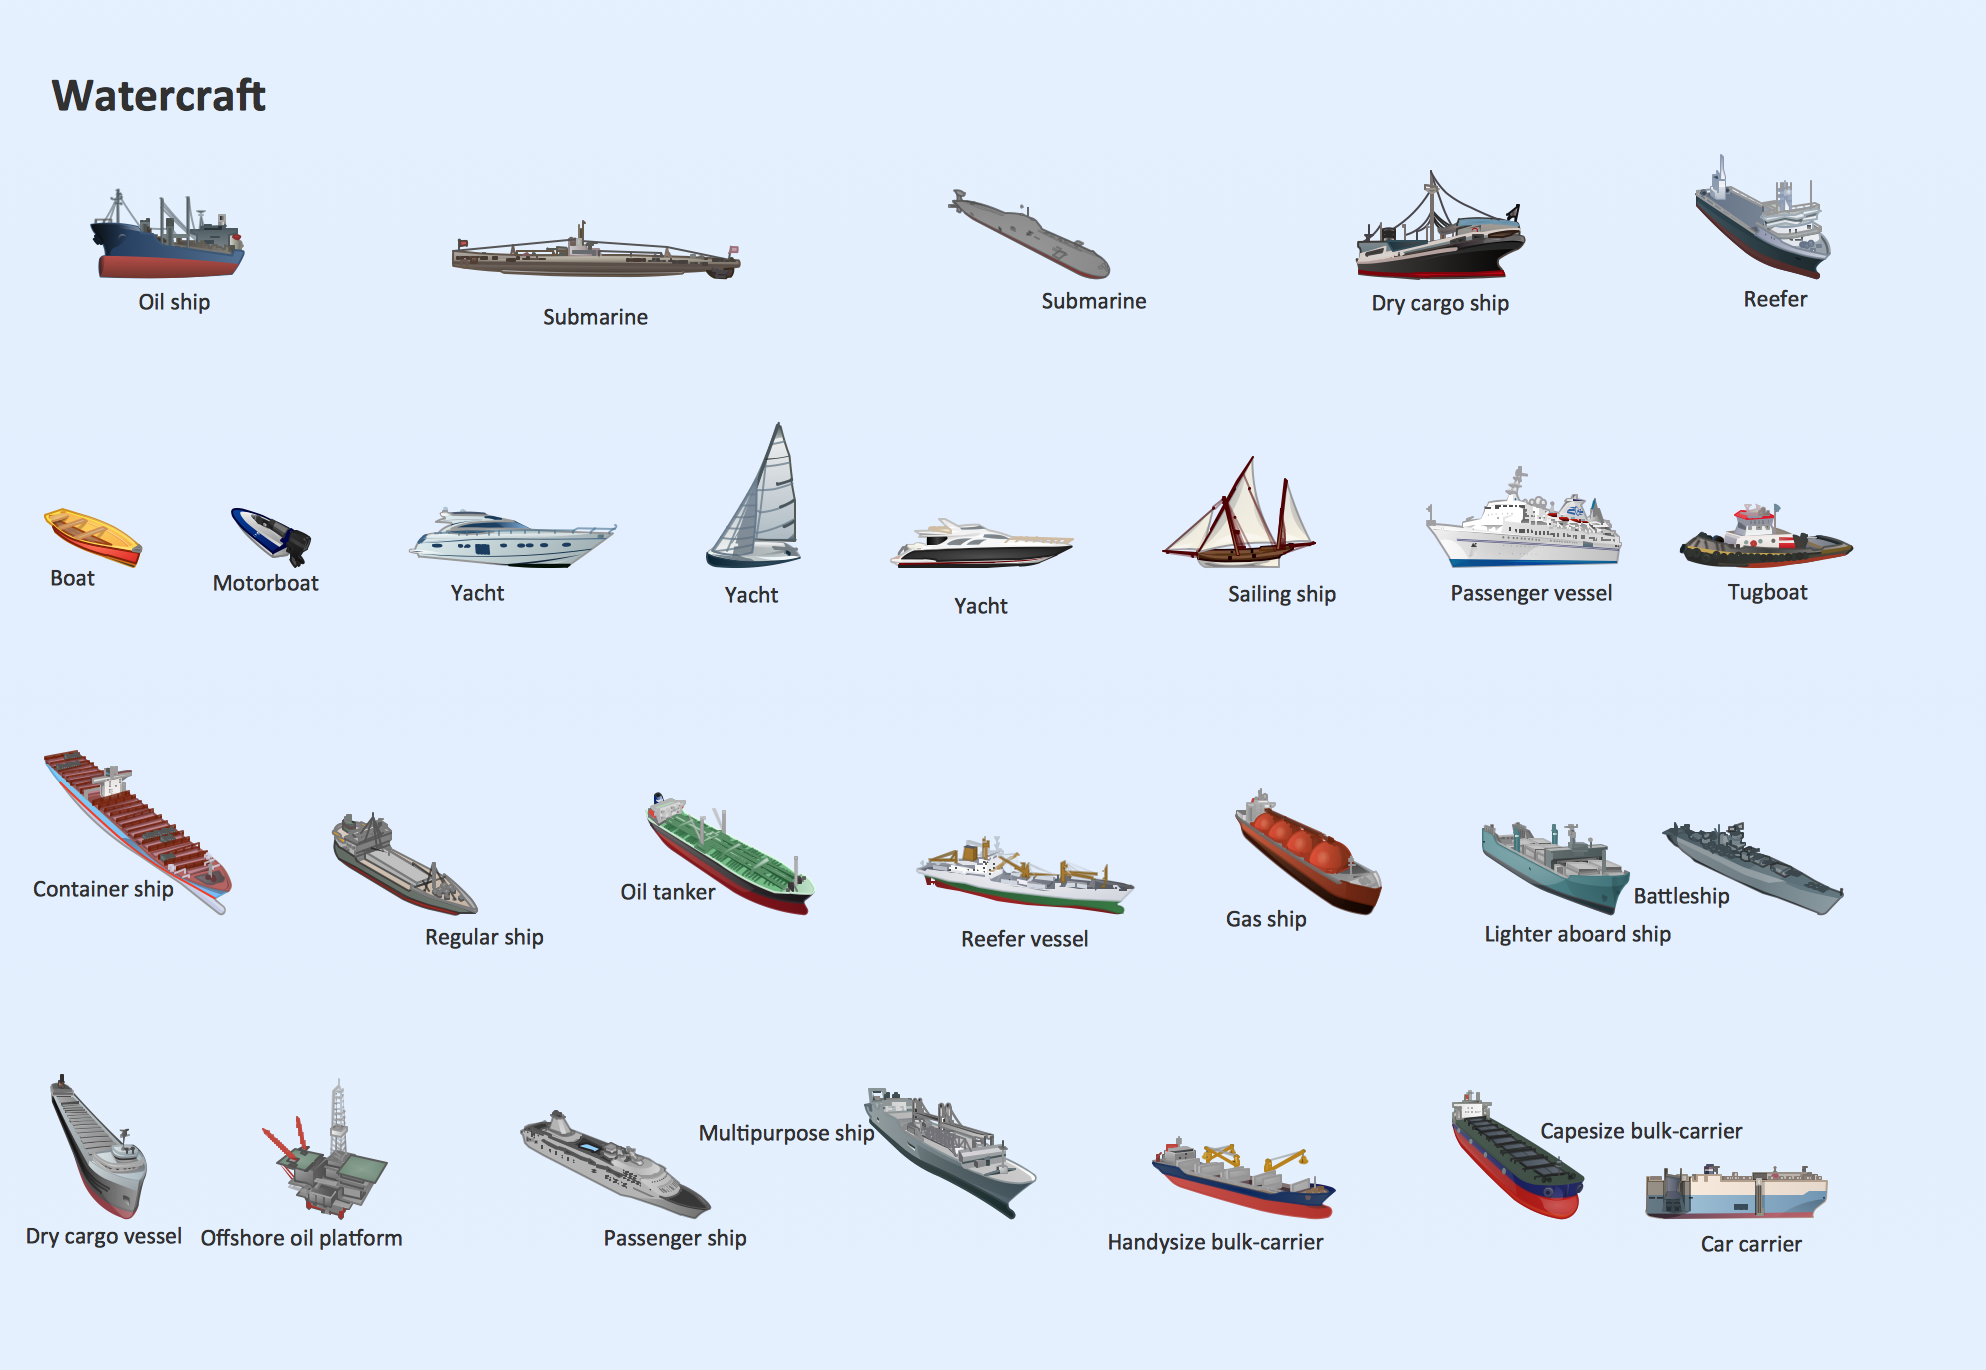
Use it to draw illustrations of vessels and water transport over a sea, ocean, lake, canal, river.
ERD Symbols and Meanings

The Chen's ERD notation is still used and is considered to present a more detailed way of representing entities and relationships.
To create an ERD, software engineers mainly turn to dedicated drawing software, which contain the full notation resources for their specific database design - ERD symbols and meanings. CS Odessa has released an all-inclusive Entity-Relationship Diagram (ERD) solution for their powerful drawing program, ConceptDraw DIAGRAM.

This vector stencils library contains 195 cloud computing icons.
Use it to design cloud computing infographic and diagrams with ConceptDraw PRO software.
"Cloud computing, also on-demand computing, is a kind of Internet-based computing that provides shared processing resources and data to computers and other devices on demand. It is a model for enabling ubiquitous, on-demand access to a shared pool of configurable computing resources (e.g., networks, servers, storage, applications and services), which can be rapidly provisioned and released with minimal management effort. Cloud computing and storage solutions provide users and enterprises with various capabilities to store and process their data in third-party data centers.
Cloud computing has become a highly demanded service or utility due to the advantages of high computing power, cheap cost of services, high performance, scalability, accessibility as well as availability." [Cloud computing. Wikipedia]
The vector stencils library "Cloud clipart" is included in the Cloud Computing Diagrams solution from the Computer and Networks area of ConceptDraw Solution Park.
Access point

Airport

Alert

Banknote

Banknote bundle

Banknote bundles

Backup

Bar chart

Big data

Book (closed)
-cloud-clipart---vector-stencils-library.png--diagram-flowchart-example.png)
Book (open)
-cloud-clipart---vector-stencils-library.png--diagram-flowchart-example.png)
Books

Box, close

Box, open

Braces

Brackets

Bug

Building

Bus

Cable connection

Calculator

Calendar

Car

CD/DVD

Check list

Check mark

Clock

Cloud

Cloud computing

Cloud database

Cloud hosting

Cloud storage

Code

Coffee cup

Coin

Coins stack

Coins stacks

Communication

Computer terminal

Console

CPU

Credit card

Cubes

Dashboard

Database

Databases

Datacenter

Dialog box

Dialog boxes

Document

Documents

Dollar sign

Download

Earth

Email

Equal sign

Ethernet jack

Ethernet plug

Euro sign

Exclamation mark

Eye

Feed symbol

Feedback

File

Files

Filter

Firewall

Flash drive

Folder

Folders

Gamepad

Gauge

Gear

Gears, 2

Gears, 3

Globe

Hacker

Hard drive

Heart

Heart rhythm

Home

Hosting

Hotel

House

Image

Info

IP phone

Jet

Key

Keyboard

Laptop

Lego

Letter

Light bulb

Lightning

Line chart

Linux penguin

List

Load balancer

Location mark

Lock, close

Lock, open

Lock and key

Log

Login

Logout

Magnifying glass

Mail

Map

Memory (RAM)
-cloud-clipart---vector-stencils-library.png--diagram-flowchart-example.png)
Microphone

Minus sign

Mobile phone

Monitor

Mouse

Movie

Music

Music player

Network

Network bus

Newspaper

NIC (Network interface controller)
-cloud-clipart---vector-stencils-library.png--diagram-flowchart-example.png)
Not found (Error 404)
-cloud-clipart---vector-stencils-library.png--diagram-flowchart-example.png)
Notebook

Office printer

Operator

Page

Pages

PC

Pencil

Photo

Photo camera

Pie chart

Platform

Plus sign

Pound sign

Printer

Puzzle

Puzzles, 2x2

Puzzles, 3x3

Question sign

Rackmount server

Router

Safe

Satellite

Satellite antenna

Schedule

Sensor

Server

Server rack

Shield

Ship

Shopping bag

Shopping basket

Shopping cart

Sign up

Smartphone

Social network

Software box

Sound

Spider

Spreadsheet

SSD

Star

Stars, 5

Stethoscope

Stickman

Stickmen

Suitcase

Support

Switch

Syringe

Tablet computer

Tools

Train

Truck

Truck 2

TV

Umbrella

Upload

User man

User woman

User profile

Video

Video camera

Video mail

Virtual disk

Virus

Wallet

Web camera

Wifi antenna

Wireless

Wrench

X cross symbol

Yen sign

- Example Network Layout Of A Ship
- Examples Of Satellites In Space
- Network Diagram Examples | Computers and network isometric ...
- Satellite Clipart
- How To use Switches in Network Diagram | VMware vNetwork ...
- Radio networks. Computer and Network Examples | Electrical ...
- Phone networks. Computer and Network Examples | Mobile satellite ...
- Mobile satellite TV network diagram | Satellite telecom network ...
- Mesh Network Topology Diagram | Hybrid satellite and common ...
- Png Ship
- ERD | Entity Relationship Diagrams, ERD Software for Mac and Win
- Flowchart | Basic Flowchart Symbols and Meaning
- Flowchart | Flowchart Design - Symbols, Shapes, Stencils and Icons
- Flowchart | Flow Chart Symbols
- Electrical | Electrical Drawing - Wiring and Circuits Schematics
- Flowchart | Common Flowchart Symbols
- Flowchart | Common Flowchart Symbols