7 Continents Map

Geo Mapping Software Examples - World Map Outline

Continents and Oceans Map

Geo Map - World

Map Software

 Continent Maps
Continent Maps solution extends ConceptDraw DIAGRAM software with templates, samples and libraries of vector stencils for drawing the thematic maps of continents, state maps of USA and Australia.
Map of Continents

Best Tool for Infographic Construction

"A thematic map is a type of map or chart especially designed to show a particular theme connected with a specific geographic area. ...
A thematic map is a map that focuses on a specific theme or subject area, whereas in a general map the variety of phenomena - geological, geographical, political - regularly appear together. ...
Thematic maps emphasize spatial variation of one or a small number of geographic distributions. These distributions may be physical phenomena such as climate or human characteristics such as population density and health issues. ...
Thematic map are sometimes referred to as graphic essays that portray spatial variations and interrelationships of geographical distributions. Location, of course, is important to provide a reference base of where selected phenomena are occurring. ...
Thematic maps serve three primary purposes.
First, they provide specific information about particular locations.
Second, they provide general information about spatial patterns.
Third, they can be used to compare patterns on two or more maps." [Thematic map. Wikipedia]
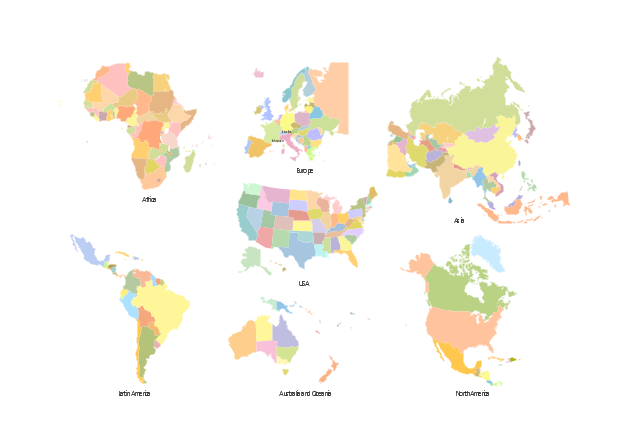
The vector stencils library "Thematic maps" contains 7 continent map contours for creating the thematic maps of geographic regions displaying the metric values by countries, states and territories marked by different colors.
Use the design elements library "Thematic maps" to create spatial dashboards using the ConceptDraw PRO diagramming and vector drawing software for your Spatial Intelligence and Location Intelligence business practice.
The example "Design elements - Thematic maps" is included in the Spatial Dashboard solution from the area "What is a Dashboard" of ConceptDraw Solution Park.
A thematic map is a map that focuses on a specific theme or subject area, whereas in a general map the variety of phenomena - geological, geographical, political - regularly appear together. ...
Thematic maps emphasize spatial variation of one or a small number of geographic distributions. These distributions may be physical phenomena such as climate or human characteristics such as population density and health issues. ...
Thematic map are sometimes referred to as graphic essays that portray spatial variations and interrelationships of geographical distributions. Location, of course, is important to provide a reference base of where selected phenomena are occurring. ...
Thematic maps serve three primary purposes.
First, they provide specific information about particular locations.
Second, they provide general information about spatial patterns.
Third, they can be used to compare patterns on two or more maps." [Thematic map. Wikipedia]
The vector stencils library "Thematic maps" contains 7 continent map contours for creating the thematic maps of geographic regions displaying the metric values by countries, states and territories marked by different colors.
Use the design elements library "Thematic maps" to create spatial dashboards using the ConceptDraw PRO diagramming and vector drawing software for your Spatial Intelligence and Location Intelligence business practice.
The example "Design elements - Thematic maps" is included in the Spatial Dashboard solution from the area "What is a Dashboard" of ConceptDraw Solution Park.
Thematic map templates
Superb Examples of Infographic Maps

Informative and Well-Designed Infographics

 HR Dashboard
The HR Dashboard solution extends ConceptDraw DIAGRAM functionality with powerful drawing tools and great collection of comprehensive vector design elements, icons, pictograms and objects, navigation elements, live objects of HR charts, HR indicators, and thematic maps. The range of HR Dashboards applications is extensive, among them the human resource management, recruitment, hiring process, human resource development. ConceptDraw DIAGRAM software is perfect for creation HR Dashboard with any goal you need. It gives you all opportunities for designing not only informative, but also professional looking and attractive HR Dashboards of any style and degree of detalization, that are perfect for using in presentations, reports and other thematic documents.
World Continents Map

Tools to Create Your Own Infographics

Directions Maps

Geo Map — Australia — New Zealand

Geo Map — Europe — Spain

Geo Map - Europe - Czech Republic

 Pie Charts
Pie Charts are extensively used in statistics and business for explaining data and work results, in mass media for comparison (i.e. to visualize the percentage for the parts of one total), and in many other fields. The Pie Charts solution for ConceptDraw DIAGRAM offers powerful drawing tools, varied templates, samples, and a library of vector stencils for simple construction and design of Pie Charts, Donut Chart, and Pie Graph Worksheets.
Geo Map — Europe — Greece

The vector stencils library Greece contains contours for ConceptDraw DIAGRAM diagramming and vector drawing software. This library is contained in the Continent Maps solution from Maps area of ConceptDraw Solution Park.
- The Seven Continents Templates
- 7 Continents Map | World Continents Map | Continents Map ...
- Pie Charts | Continent Maps | Basic Pie Charts | Pie Graph Of 7 ...
- 7 Continents Map | Continent Maps | Informative and Well-Designed ...
- Informative and Well-Designed Infographics | Continent Maps | How ...
- 7 Continents Map | World Continents Map | Continent Maps | Draw ...
- Continent Maps | Continents Map | 7 Continents Map | Continents ...
- Australia states time zones - Thematic map | 7 Continents Map ...
- Geo Mapping Software Examples - World Map Outline | World ...
- Australia map - Template | Maps | Continent Maps | Australia Map ...
- Geo Map - Asia - India | Asia map with capitals - Template ...
- Continent Maps | 7 Continents Map | Continents Map | Continent ...
- ConceptDraw Solution Park | Geo Map Software | Continent Maps ...
- Africa map with countries, main cities and capitals - Template | Maps ...
- Geo Map — South America Continent | Geo Map — United States of ...
- Continents Map | Asia map with capitals - Template | Geo Map - Asia ...
- Aerospace and Transport | Continent Maps | Network Diagram ...
- Continent Maps | Geo Map — South America Continent | Continents ...
- Spatial infographics Design Elements: Continental Map | Continents ...
- Continent Maps | Geo Mapping Software Examples - World Map ...
- ERD | Entity Relationship Diagrams, ERD Software for Mac and Win
- Flowchart | Basic Flowchart Symbols and Meaning
- Flowchart | Flowchart Design - Symbols, Shapes, Stencils and Icons
- Flowchart | Flow Chart Symbols
- Electrical | Electrical Drawing - Wiring and Circuits Schematics
- Flowchart | Common Flowchart Symbols
- Flowchart | Common Flowchart Symbols