This site uses cookies. By continuing to browse the ConceptDraw site you are agreeing to our Use of Site Cookies.

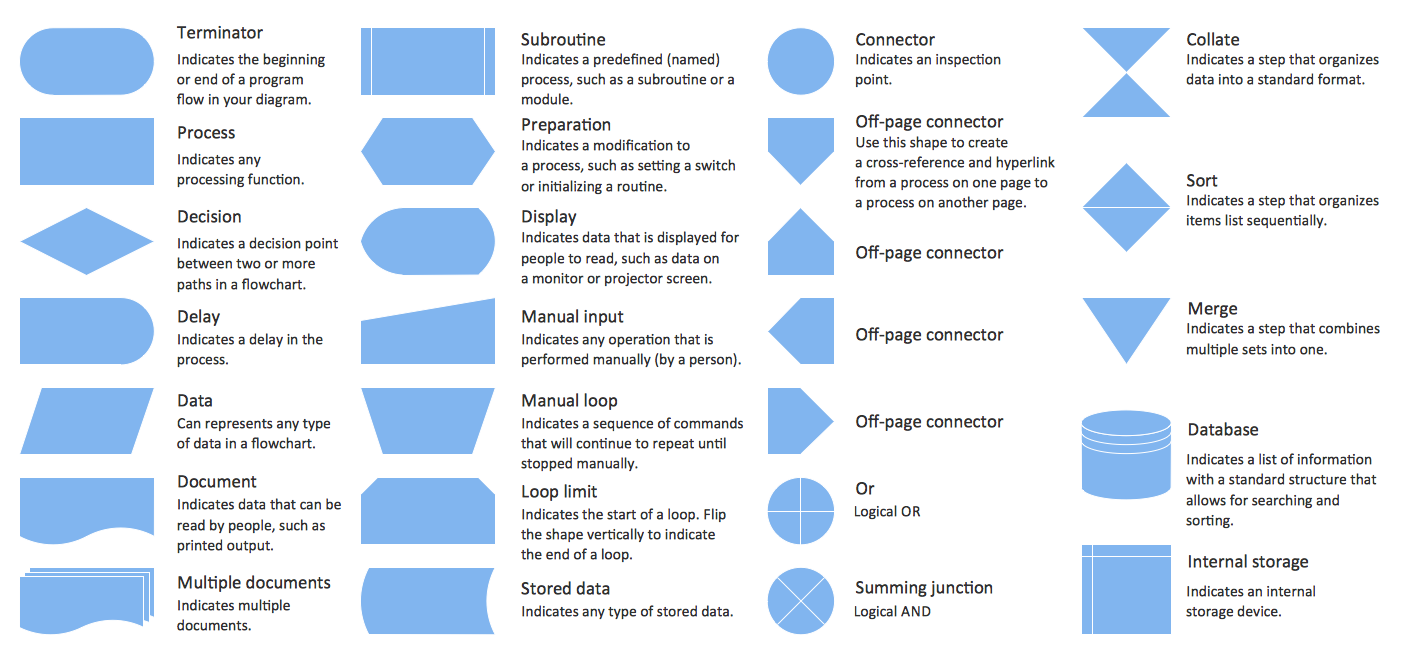
Basic Flowchart Symbols and Meaning

Flowchart Symbols and Meaning - Provides a visual representation of basic flowchart symbols and their proposed use in professional workflow diagram, standard process flow diagram and communicating the structure of a well-developed web site, as well as their correlation in developing on-line instructional projects. See flowchart's symbols by specifics of process flow diagram symbols and workflow diagram symbols.
How to Build a Flowchart

How to Draw a Flowchart

Are you confused on how to draw a flow chart? Here are some guidelines which can be used to ease the process of understanding the system and its flow.
Although there are many symbols that can be used in flowcharts to represent different kinds of steps, accurate flowcharts can be created using very few (e.g. Process, Decision, Start, delay, cloud).

Flowchart Definition

Flowchart definition - A Flowchart is a graphically representation of the structure of process or system, algorithm or the step-by-step solution of the problem. The Flowchart describes the flow of data through an information processing systems and the parts of the flows. The flow is a set of the logic operations that meet the certain requirements.

Types of Flowcharts

A Flowchart is a graphically representation of the process, algorithm or the step-by-step solution of the problem. There are ten types of Flowcharts. Using the Flowcharts solution from the Diagrams area of ConceptDraw Solution Park you can easy and quickly design the Flowchart of any of these types.
How to Simplify Flow Charting

Flowchart

With ConceptDraw DIAGRAM it is easy to create professional flowchart diagrams of any complexity. With the use of numerous templates and the extensive libraries of ready-made symbols and blocks; depicting your business processes has never been easier.

Flowchart Programming Project. Flowchart Examples

Create you own flow charts of process-driven software applications using the ConceptDraw DIAGRAM diagramming and vector drawing software extended with the Cross-Functional Flowcharts solution from the Business Processes area of ConceptDraw Solution Park.
The programming project flow chart example shows the logical process of execution.

Examples of Flowcharts, Org Charts and More

ConceptDraw examples covers a broad spectrum of business graphics categories. We separated all the graphic documents on application areas and had produced multiple solutions for each of them. ConceptDraw provides a wide variety of examples such as flowcharts, organizational charts, business charts, UML diagrams, database and ERD, directional map, network diagrams and lots more. Each solution accommodates 10+ examples that shows specific application cases of a diagram. ConceptDraw STORE is an application for downloading solutions with examples, templates and stencil libraries. Please choose any examples you are interested in, alternatively download them for free; you will need to install ConceptDraw to view them. As you will see, ConceptDraw is very powerful, you can use more than 10000 symbols, examples, and many pre-drawn templates, to create your own spectacular flowcharts, business diagrams, network diagrams and lots more, effortlessly, and in no time at all.
What is ConceptDraw OFFICE

Entity Relationship Diagram Symbols

Creating an entity-relationship (ER) model is to visually represent the structure of a business database, where data equates to entities (or objects) that are linked by defined relationships expressing dependencies and requirements. By nature it is an abstract visualization, the first step in the design process towards creating a logical and functional database.
ERD symbols used for professional ERD drawing are collected in libraries from the Entity-Relationship Diagram (ERD) solution for ConceptDraw DIAGRAM.

Flowchart design. Flowchart symbols, shapes, stencils and icons

A flowchart is a type of diagram that represents an algorithm, workflow or process, showing the steps as boxes of various kinds - flowchart symbols, and their order by connecting them with arrows.
Mavericks have always desired to stand apart and gorgeous design is the recipe for that. Any business graphic document will be more understandable if will use an expository color scheme for their parts. Flowchart design makes versatile presenting and explaining of the process and gives a fresh view that distinguishes it from black and white flowcharts on a paper. Workflow diagram or process flow diagrams become more understandable to ordinary people when it use minimum symbols and special signs.
The best design can be accomplished by starting from any of the suitable Conceptdraw examples. Pick one of them and begin to input proper text into each Flowchart symbols and shapes. Apply less colors in the document and don't turn into rainbow your diagram, three or four will be enough, also note that business process flowchart may not contain bright color hues. The next clue is to use identical colors for same flowchart shape types.
Business Process Modeling with ConceptDraw
Business Process Modeling with ConceptDraw "Business Process Diagrams" Solution

Flowchart Software

To design the professional looking Flowchart Diagrams use ConceptDraw DIAGRAM diagramming and vector drawing software extended with Flowchart maker solutions from the Diagrams area of ConceptDraw Solution Park.
The Flowcharts diagrams are widely used for designing, documenting, analyzing and managing the complex processes and programs in various fields such as business, engineering, architecture, science, manufacturing, administration, etc.