"Porter five forces analysis is a framework for industry analysis and business strategy development. It draws upon industrial organization (IO) economics to derive five forces that determine the competitive intensity and therefore attractiveness of a market. Attractiveness in this context refers to the overall industry profitability. An "unattractive" industry is one in which the combination of these five forces acts to drive down overall profitability. A very unattractive industry would be one approaching "pure competition", in which available profits for all firms are driven to normal profit.
Three of Porter's five forces refer to competition from external sources. The remainder are internal threats.
Porter referred to these forces as the micro environment, to contrast it with the more general term macro environment. They consist of those forces close to a company that affect its ability to serve its customers and make a profit. A change in any of the forces normally requires a business unit to re-assess the marketplace given the overall change in industry information. The overall industry attractiveness does not imply that every firm in the industry will return the same profitability. Firms are able to apply their core competencies, business model or network to achieve a profit above the industry average. A clear example of this is the airline industry. As an industry, profitability is low and yet individual companies, by applying unique business models, have been able to make a return in excess of the industry average.
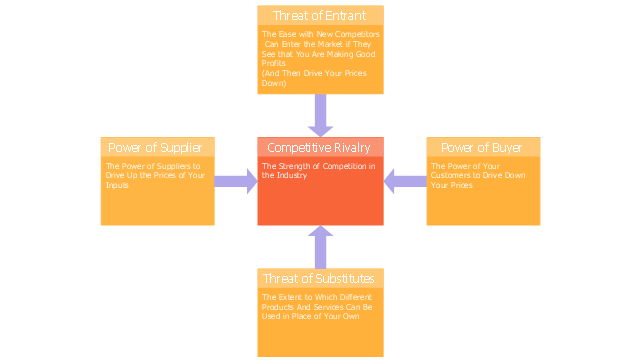
Porter's five forces include - three forces from 'horizontal' competition: the threat of substitute products or services, the threat of established rivals, and the threat of new entrants; and two forces from 'vertical' competition: the bargaining power of suppliers and the bargaining power of customers.
This five forces analysis, is just one part of the complete Porter strategic models. The other elements are the value chain and the generic strategies." [Porter five forces analysis. Wikipedia]
The block diagram example "Porter's five forces model" was created using the ConceptDraw PRO diagramming and vector drawing software extended with the Block Diagrams solution from the area "What is a Diagram" of ConceptDraw Solution Park.
Three of Porter's five forces refer to competition from external sources. The remainder are internal threats.
Porter referred to these forces as the micro environment, to contrast it with the more general term macro environment. They consist of those forces close to a company that affect its ability to serve its customers and make a profit. A change in any of the forces normally requires a business unit to re-assess the marketplace given the overall change in industry information. The overall industry attractiveness does not imply that every firm in the industry will return the same profitability. Firms are able to apply their core competencies, business model or network to achieve a profit above the industry average. A clear example of this is the airline industry. As an industry, profitability is low and yet individual companies, by applying unique business models, have been able to make a return in excess of the industry average.
Porter's five forces include - three forces from 'horizontal' competition: the threat of substitute products or services, the threat of established rivals, and the threat of new entrants; and two forces from 'vertical' competition: the bargaining power of suppliers and the bargaining power of customers.
This five forces analysis, is just one part of the complete Porter strategic models. The other elements are the value chain and the generic strategies." [Porter five forces analysis. Wikipedia]
The block diagram example "Porter's five forces model" was created using the ConceptDraw PRO diagramming and vector drawing software extended with the Block Diagrams solution from the area "What is a Diagram" of ConceptDraw Solution Park.
Block diagram

"Porter five forces analysis is a framework for industry analysis and business strategy development. It draws upon industrial organization (IO) economics to derive five forces that determine the competitive intensity and therefore attractiveness of a market. Attractiveness in this context refers to the overall industry profitability. An "unattractive" industry is one in which the combination of these five forces acts to drive down overall profitability. A very unattractive industry would be one approaching "pure competition", in which available profits for all firms are driven to normal profit.
Three of Porter's five forces refer to competition from external sources. The remainder are internal threats.
Porter referred to these forces as the micro environment, to contrast it with the more general term macro environment. They consist of those forces close to a company that affect its ability to serve its customers and make a profit. A change in any of the forces normally requires a business unit to re-assess the marketplace given the overall change in industry information. The overall industry attractiveness does not imply that every firm in the industry will return the same profitability. Firms are able to apply their core competencies, business model or network to achieve a profit above the industry average. A clear example of this is the airline industry. As an industry, profitability is low and yet individual companies, by applying unique business models, have been able to make a return in excess of the industry average.
Porter's five forces include - three forces from 'horizontal' competition: the threat of substitute products or services, the threat of established rivals, and the threat of new entrants; and two forces from 'vertical' competition: the bargaining power of suppliers and the bargaining power of customers.
This five forces analysis, is just one part of the complete Porter strategic models. The other elements are the value chain and the generic strategies." [Porter five forces analysis. Wikipedia]
The block diagram example "Porter's five forces model" was created using the ConceptDraw PRO diagramming and vector drawing software extended with the Block Diagrams solution from the area "What is a Diagram" of ConceptDraw Solution Park.
Block diagram
"Dimensions of service quality.
A customer's expectation of a particular service is determined by factors such as recommendations, personal needs and past experiences. The expected service and the perceived service sometimes may not be equal, thus leaving a gap. The service quality model or the ‘GAP model’ developed by a group of authors- Parasuraman, Zeithaml and Berry at Texas and North Carolina in 1985 , highlights the main requirements for delivering high service quality. It identifies five ‘gaps’ that cause unsuccessful delivery. Customers generally have a tendency to compare the service they 'experience' with the service they 'expect' . If the experience does not match the expectation , there arises a gap. Ten determinants that may influence the appearance of a gap were described by Parasuraman, Zeithaml and Berry. in the SERVQUAL model: reliability, responsiveness, competence, access, courtesy, communication, credibility, security, understanding the customer and tangibles.
Later, the determinants were reduced to five: tangibles; reliability; responsiveness; service assurance and empathy in the so called RATER model." [Service quality. Wikipedia]
The block diagram example "Gap model of service quality" was created using the ConceptDraw PRO diagramming and vector drawing software extended with the Block Diagrams solution from the area "What is a Diagram" of ConceptDraw Solution Park.
Block diagram

 Block Diagrams
Block diagrams solution extends ConceptDraw PRO software with templates, samples and libraries of vector stencils for drawing the block diagrams.
The vector stencils library "Marketing diagrams" contains 9 templates of marketing and sales diagrams and charts.
Use these shapes to illustrate your marketing and sales documents, presentations, infographics and webpages in the ConceptDraw PRO diagramming and vector drawing software extended with the Marketing Diagrams solution from the Marketing area of ConceptDraw Solution Park.
www.conceptdraw.com/ solution-park/ marketing-diagrams
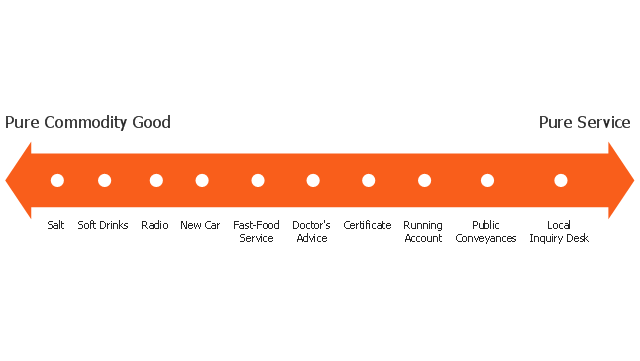
Service-goods continuum diagram
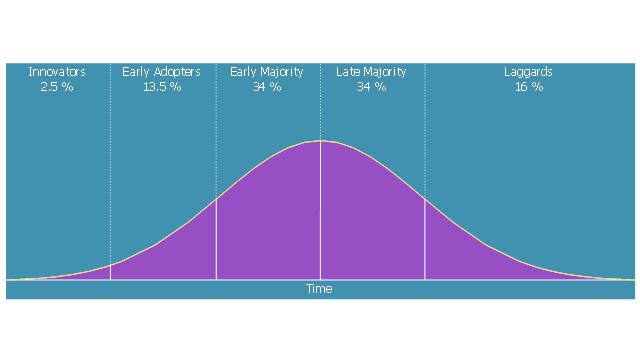
Diffusion of Innovations
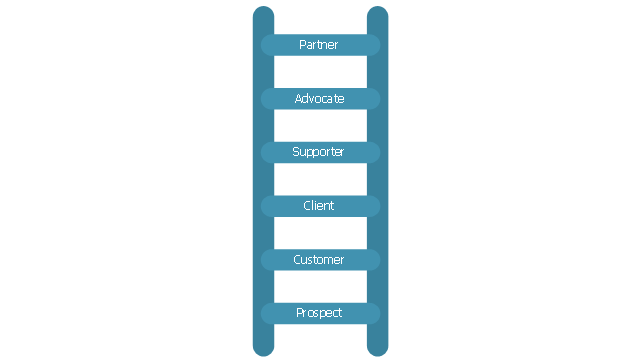
Relationship ladder of customer loyalty
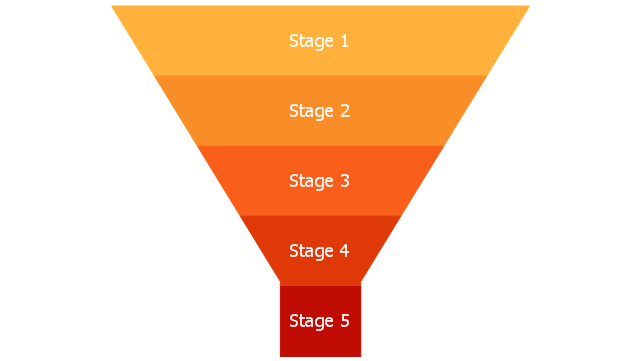
Leaky bucket diagram

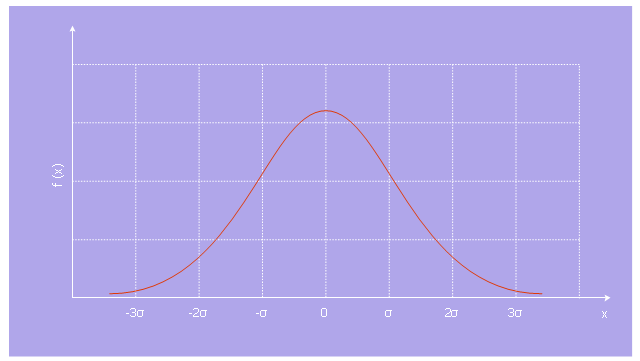
Normal distribution
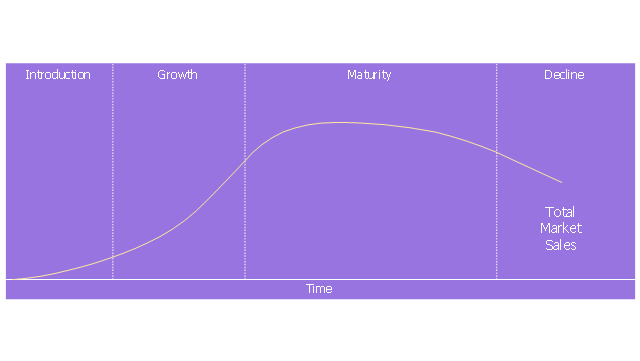
Product life cycle graph
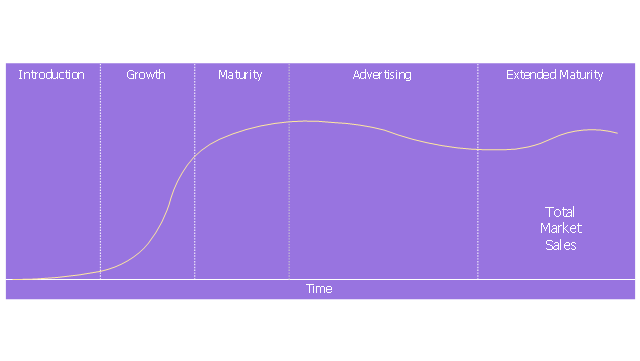
Extended product life cycle graph
Five forces model
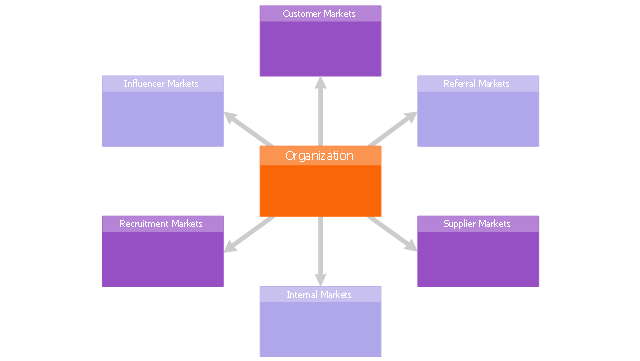
Six markets model
Step chart block
Step diagram block

 Telecommunication Network Diagrams
Telecommunication Network Diagrams solution extends ConceptDraw PRO software with samples, templates, and great collection of vector stencils to help the specialists in a field of networks and telecommunications, as well as other users to create Computer systems networking and Telecommunication network diagrams for various fields, to organize the work of call centers, to design the GPRS networks and GPS navigational systems, mobile, satellite and hybrid communication networks, to construct the mobile TV networks and wireless broadband networks.
 Marketing Diagrams
This solution extends ConceptDraw PRO with samples, templates and library of design elements for drawing the marketing diagrams.
 Marketing Area
The solutions from Marketing area of ConceptDraw Solution Park collect templates, samples and libraries of vector stencils for drawing the marketing diagrams and mind maps.
 Marketing
This solution extends ConceptDraw PRO v9 and ConceptDraw MINDMAP v7 with Marketing Diagrams and Mind Maps (brainstorming, preparing and holding meetings and presentations, sales calls).
 Comparison Dashboard
Comparison dashboard solution extends ConceptDraw PRO software with samples, templates and vector stencils library with charts and indicators for drawing the visual dashboard comparing data.
 Wireless Networks
The Wireless Networks Solution extends ConceptDraw PRO software with professional diagramming tools, set of wireless network diagram templates and samples, comprehensive library of wireless communications and WLAN objects to help network engineers and designers efficiently design and create Wireless network diagrams that illustrate wireless networks of any speed and complexity, and help to identify all required equipment for construction and updating wireless networks, and calculating their costs.
- Porter's generic strategies matrix diagram | Block diagram - Porter's ...
- SWOT Analysis | Block diagram - Porter's five forces model | SWOT ...
- Block diagram - Porter's five forces model | Block diagram - Six ...
- 5 level pyramid model diagram of information systems types ...
- Block diagram - Gap model of service quality
- Block diagram - Six markets model | Block diagram - Porter's five ...
- Block diagram - Porter's five forces model | Porter S 5 Forces Diagram
- Pyramid Diagram | Pyramid Chart Examples | Block diagram - Five ...
- Block diagram - Five forces model
- Block diagram - Porter's five forces model
- Block diagram - Porter's five forces model | Marketing | Marketing ...
- Block diagram - Porter's five forces model | Types of Flowcharts ...
- Marketing | Block Diagrams | Business Productivity Area | Five Force ...
- Block diagram - Porter's five forces model | Block diagram - Branding ...
- Block diagram - Porter's five forces model | Matrices | Porter's Value ...
- Block Diagrams | Create Block Diagram | Basic Diagramming | Block ...
- Block diagram - Porter's five forces model | Create Block Diagram ...
- Block diagram - Porter's five forces model | Porter's Value Chain ...
- Design elements - Matrices | Block diagram - Porter's five forces ...
- Block diagram - Porter's five forces model | Target diagrams - Vector ...
- ERD | Entity Relationship Diagrams, ERD Software for Mac and Win
- Flowchart | Basic Flowchart Symbols and Meaning
- Flowchart | Flowchart Design - Symbols, Shapes, Stencils and Icons
- Flowchart | Flow Chart Symbols
- Electrical | Electrical Drawing - Wiring and Circuits Schematics
- Flowchart | Common Flowchart Symbols
- Flowchart | Common Flowchart Symbols