This site uses cookies. By continuing to browse the ConceptDraw site you are agreeing to our Use of Site Cookies.
HelpDesk

How to Create a Bar Chart in ConceptDraw PRO

Bar charts (bar graphs) are diagrams displaying data as horizontal or vertical bars of certain heights.
Bar charts are widely used to show and compare the values of the same parameters for different data groups.
The bar graph can be vertical or horizontal. This depends on the amount of categories. There are many methods in which bar graph can be built and this makes it a very often used chart type. Usually, a bar chart is created so that the bars are placed vertically. Such arrangement means that the bar's height value is proportional to the category value. Nevertheless, a bar chart can be also drawn horizontally. This means that the longer the bar, the bigger the category. Thus, a bar chart is a good way to present the relative values of different measured items. The ConceptDraw Bar Graphs solution allows you to draw a bar chart quickly using a vector library, containing the set of various bar charts objects.

draw bar chart, draw bar graph, draw column chart Bar Graphs

draw bar chart, draw bar graph, draw column chart
The Bar Graphs solution enhances ConceptDraw PRO v10 functionality with templates, numerous professional-looking samples, and a library of vector stencils for drawing different types of Bar Graphs, such as Simple Bar Graph, Double Bar Graph, Divided Bar Graph, Horizontal Bar Graph, Vertical Bar Graph, and Column Bar Chart.

draw histogram, histogram Histograms

draw histogram, histogram
How to make a Histogram? Making a Histogram is an incredibly easy process when it is done with ConceptDraw PRO. The Histograms Solution enhances ConceptDraw PRO v10 functionality with extensive drawing tools, numerous samples, and examples; also a quick-start template and library of ready vector stencils for visualization the data and professional drawing Histograms.
HelpDesk

How to Add Text to a Connector in ConceptDraw PRO

The new ConceptDraw Arrows10 Technology is a powerful diagramming technique that powered the way business drawing created. ConceptDraw PRO gives you some tools for connecting shapes: Direct Connectors, Smart, Arc, Bezier, Curve and Round Connectors.Direct Connectors are direct lines from the point to the point. Smart , Arc, Bezier, Curve and Round Connectors are almost the same as Direct Connectors. However, they automatically move around other objects. You can use Chain, or Tree connection mode for connection of multiple objects with any type of connectors. ConceptDraw PRO allows you to add and move text on a connector the same way that you add and move text on other any object.

composition charts Composition Dashboard

composition charts
Composition dashboard solution extends ConceptDraw PRO software with templates, samples and vector stencils library with charts and indicators for drawing visual dashboards showing data composition.
HelpDesk

How to Use a Cross - Functional Flowcharts Solution

Cross-functional process is a process that involves multiple divisions, each of which makes its part of the entire company workflow. For example: product development, lead management , client orders processing – and other critical processes. Using a Cross-Functional flowchart is a clear way of showing each team member’s responsibilities and how processes get shared or transferred between different teams and departments.The Cross-Functional flowchart is a clear way to visualize the document flow in your organization. The ability to create Cross-functional diagrams is provided by the Cross-Functional Flowcharts solution.
<nobr> Cross-Functional Flowchart</nobr>
Cross-Functional Flowchart
HelpDesk

How to Create a Cross - Functional Flowchart Using ConceptDraw PRO

Cross-functional flowcharts are used to visualize cross-functional processes. Cross-functional process is a process that involves multiple divisions, each of which makes its part of the entire company workflow. For example: product development, lead management , client orders processing – and other critical processes. All of them are important both for business and customers, but the workflow and responsibilities distribution within these processes are divided between multiple departments and services. Cross-functional processes cannot be depicted with simple workflow diagrams, because of the specific interactions between company departments. ConceptDraw PRO has released the specialized solution to create cross-functional diagrams. Cross Functional Flowcharts solution includes a special set of templates and libraries to depict the cross-functional processes.

cross-functional flowchart template, flowchart, example business process flow Cross-Functional Flowcharts

cross-functional flowchart template, flowchart, example business process flow
Cross-functional flowcharts are powerful and useful tool for visualizing and analyzing complex business processes which requires involvement of multiple people, teams or even departments. They let clearly represent a sequence of the process steps, the order of operations, relationships between processes and responsible functional units (such as departments or positions).
HelpDesk

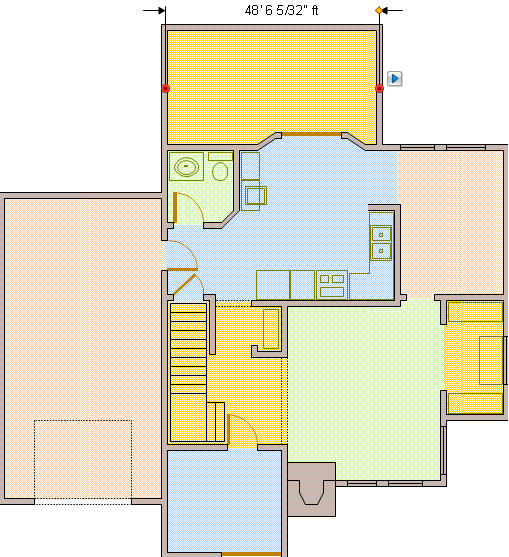
How to Create a Building Plan Using ConceptDraw PRO

Making a detailed floor plan involves many different elements. Whether it is a home, office, business center, restaurant, shop store, or any other building type. Without the basic plan a building project. The basic floor plan is assurance of correct implementation of architectural ideas, engineering, and design solutions. The basic building and floor planning can be managed using ConceptDraw PRO. The ability to design different floor plans is delivered by the basic Floor Plans solution. Using this solution you can easily create and communicate building plans of any complexity and purposes.
HelpDesk

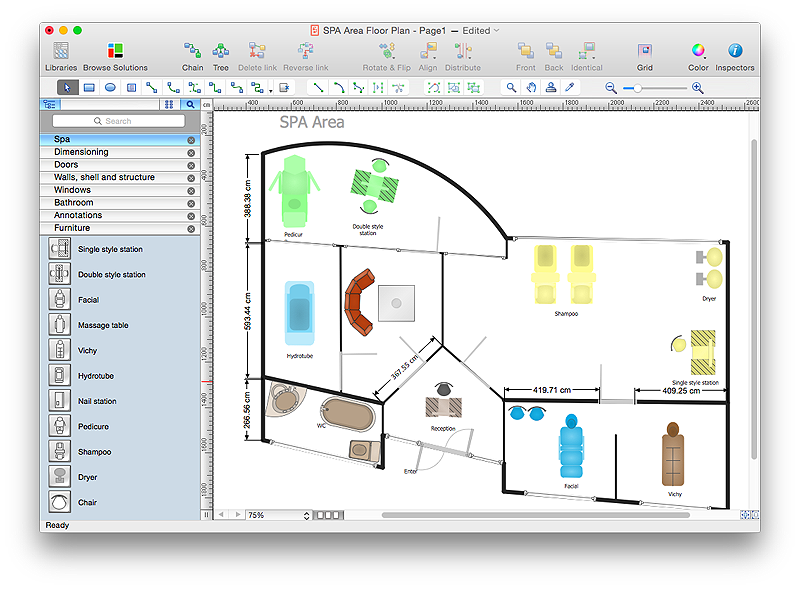
How to Draw a Floor Plan for SPA in ConceptDraw PRO

The key to a successful spa is a well designed floor plan. It should seamlessly combine both comfort and functionality. ConceptDraw PRO allows you to draw the floor Plan for your SPA or salon design using a special equipment library as well as set of special objects that displays the sizes, corners, squares and other floor plan details. You can use ConceptDraw PRO to make the SPA and Gym plans simple, accurate and easy-to-read. ConceptDraw PRO allows you to draw the floor Plan for your SPA or salon design using a special equipment library as well as set of special objects that displays the sizes, corners, squares and other floor plan details.

time series dashboard, time varying parameters Time Series Dashboard

time series dashboard, time varying parameters
Time series dashboard solution extends ConceptDraw PRO software with templates, samples and vector stencils libraries with charts, graphs and plots for drawing the visual dashboards showing data time series.
HelpDesk

How to Set Line Jumps for Smart Connectors in ConceptDraw PRO

Connecting objects in ConceptDraw PRO is an easy task. You can use Chain, or Tree connection mode for automatic connection of multiple objects. Besides the automatic connection modes, ConceptDraw PRO offers few options to connect objects manually: Direct, Arc, Bezier, Smart, Curve and Round Connectors. You can make them square, arched or angled and also set vertical or horizontal orientation Thus, you can control how the jumps and orientation occurs on smart connectors. When two smart connectors cross each other you can control how the two intersecting lines look.
HelpDesk

How to Create a Floor Plan Using ConceptDraw PRO

Making a floor plan is the best way to get a handle on how to organize your living space, and find out what could be changed. Creating a floor plan to scale is a challenge of the home and interior design process and can be noticeably helpful for visualizing things like furniture layout. You can use ConceptDraw PRO to produce layouts of real estate properties. ConceptDraw PRO contains the large quantity of pre-designed vector objects that you can use for quick and easy designing such floor plans. You  can easily determine the size of the rooms and distances in you drawing. The ability to create a floor plan is delivered by the Floor Plans solution. This solution extends ConceptDraw PRO with libraries that contains over 500 objects of floor plan elements. There is a set of special objects that displays the sizes, corners, squares and other technical details using the current measurements of units.

Bar Diagrams for Problem Solving. Create economics and financial bar charts with Bar Graphs Solution

Create bar graphs for visualizing economics problem solving and financial data comparison using the ConceptDraw PRO diagramming and vector drawing software extended with the Bar Graphs Solution from the Graphs and Charts area of ConceptDraw Solition Park.
HelpDesk

How to Create a Reflected Ceiling Floor Plan

A Reflected Ceiling Plan (RCP) is a drawing of a room or building, looking down at the interior ceiling. Making RCP involves many different reflected ceiling plan symbols that can be managed using ConceptDraw PRO. Using ConceptDraw PRO you can design the reflected ceiling floor plan that shows the location of light fixtures and any other items that may be suspended from the ceiling. You can share your ceiling design ideas by saving drawings as graphics files, or printing them.
HelpDesk

How to Design a Restaurant Floor Plan

Someone might think that creating a plan of cafe or restaurant is quite simple. But in fact it is a real art. You need to make it not only beautiful, but also convenient for visitors. Today, restaurants and cafes are not only the places, where people eat, but a places for business meetings, and recreation. Therefore, a well-designed project of the restaurant (cafe, bar) leads to successful sales and good incomes. The ConceptDraw Cafe and Restaurant Floor Plan solution includes libraries that are tailored for Cafe and Restaurants floor plans and interiors.

meter dashboard, quantitative indicators Meter Dashboard

meter dashboard, quantitative indicators
Meter dashboard solution extends ConceptDraw PRO software with templates, samples and vector stencils library with meter indicators for drawing visual dashboards showing quantitative data.

scatter chart, scatter graph, scatter plot Scatter Diagrams

scatter chart, scatter graph, scatter plot
The Scatter Diagrams solution extends ConceptDraw PRO v10 functionality with templates, samples, and a library of vector stencils that make construction of a Scatter Plot easy. The Scatter Chart Solution makes it easy to design attractive Scatter Diagrams used in various fields of science, work, and life activities. ConceptDraw PRO lets you enter the data to the table and construct the Scatter Plot Graph automatically according to these data.
HelpDesk

How To Make a PowerPoint Presentation of a Floor Plan Using ConceptDraw PRO

When designing a floor plan for a new home, or discussing the how to optimize an arrangement of an existing one, its better to have an office floor plan visual. You can use the floor plan template and make your custom home floor plan. The all you need is to run ConceptDraw PRO and its Office Plans solution. Then, you can quickly design the unique floor plan and present it to stakeholders to discuss it for making changes and adding necessary household appliances. Use ConceptDraw PRO export facilities to perform PowerPoint presentation of the floor plan of your new amazing comfortable habitation.

football, american football, football field, american football field, football field dimensions, offense, defense, football plays, football diagram Football

football, american football, football field, american football field, football field dimensions, offense, defense, football plays, football diagram
The Football Solution extends ConceptDraw PRO v9.5 (or later) software with samples, templates, and libraries of vector objects for drawing football (American) diagrams, plays schemas, and illustrations. It can be used to make professional looking documen