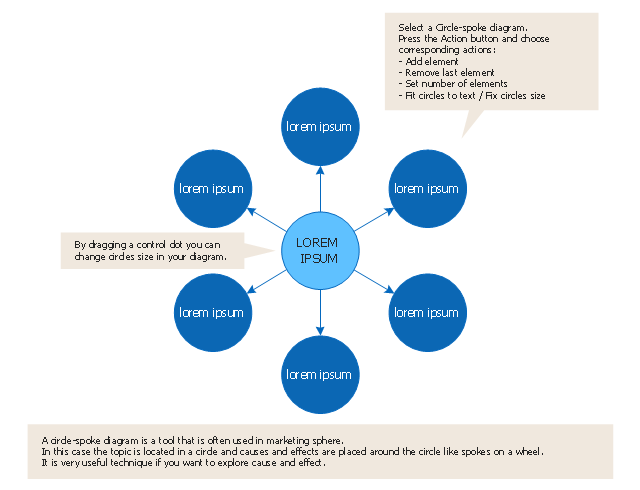
Circle Spoke Diagram Template

3 Circle Venn. Venn Diagram Example

3 Circle Venn Diagram. Venn Diagram Example

Venn Diagrams visualize all possible logical intersections between several sets and are widely used in mathematics, logic, statistics, marketing, sociology, etc.
2 Circle Venn Diagram. Venn Diagram Example

Сircle-Spoke Diagrams (Spoke charts) have a central item surrounded by other items in a circle. They are used to show the features or components of the central item in marketing and management documents and presentations.
The template "Circle spoke diagram" for the ConceptDraw PRO diagramming and vector drawing software is included in the Circle-Spoke Diagrams solution from the area "What is a Diagram" of ConceptDraw Solution Park.
The template "Circle spoke diagram" for the ConceptDraw PRO diagramming and vector drawing software is included in the Circle-Spoke Diagrams solution from the area "What is a Diagram" of ConceptDraw Solution Park.
Template
HelpDesk
How to Add a Circle-spoke Diagram to a PowerPoint Presentation Using ConceptDraw PRO

Basic Circles Venn Diagram. Venn Diagram Example

This Venn Diagram shows the relative complement of the set A with respect to the set B. It is the set of the elements in B, but not in A. In other words it is the set-theoretic difference B-A.
What Is a Circle Spoke Diagram

Use this circle chart template to design your sector diagrams.
"A chart is a graphical representation of data, in which the data is represented by symbols, such as ... slices in a pie chart. ... Charts are often used to ease understanding ... the relationships between parts of the data. ... For example, data that presents percentages in different groups (such as "satisfied, not satisfied, unsure") are often displayed in a pie chart ... A pie chart shows percentage values as a slice of a pie." [Chart. Wikipedia]
The template "Sector diagram" for the ConceptDraw PRO diagramming and vector drawing software is included in the Pie Charts solution of the Graphs and Charts area in ConceptDraw Solution Park.
Circle chart

Venn Diagram Template for Word

Circles Venn Diagram

HelpDesk
How To Create a Visio Circle-Spoke Diagram Using ConceptDraw PRO

Circular Flow Diagram Template

HelpDesk
How To Convert a Circle-Spoke Diagram to an Adobe PDF Using ConceptDraw PRO

Fishbone Diagram Template

ConceptDraw PRO diagramming and vector drawing software enhanced with Fishbone Diagrams solution helps you create business productivity diagrams from Fishbone diagram templates and examples, that provide to start using of the graphic method for the analysis of problem causes. Each predesigned Fishbone Diagram template is ready to use and useful for instantly drawing your own Fishbone Diagram.
- Circle Spoke Diagram Template | 3 Circle Venn Diagram . Venn ...
- Circle Spoke Diagram Template | Fishbone Diagram Template ...
- Venn Diagram Template
- Circle Spoke Diagram Template | Circular Flow Diagram Template ...
- 3 Circle Venn Diagram Template
- 4 Circle Venn Diagram Template
- Circle Spoke Diagram Template | Circle Diagrams | 2 Circle Venn ...
- Circle Spoke Diagram Template | Basic Flowchart Symbols and ...
- Circle Spoke Diagram Template
- Circle Spoke Diagram Template | Target diagrams - Vector stencils ...
- Circle -Spoke Diagrams | What Is a Circle Spoke Diagram | Circle ...
- 2 Circle Venn Diagram . Venn Diagram Example | Circle Spoke ...
- What Is a Circle Spoke Diagram | Circle Spoke Diagram Template ...
- 3 Circle Venn Diagram . Venn Diagram Example | 2 Circle Venn ...
- Pie Chart Word Template . Pie Chart Examples | Circular diagrams ...
- Circular Flow Diagram Template | Circle Spoke Diagram Template ...
- Circle Arrow Diagram Template
- Venn Diagram Template | 3 Circle Venn Diagram . Venn Diagram ...
- Arrow circle chart - Template | Circular Arrows | Circular Flow ...
- Circle Spoke Diagram Template | Sector diagram - Template | Circle ...
- ERD | Entity Relationship Diagrams, ERD Software for Mac and Win
- Flowchart | Basic Flowchart Symbols and Meaning
- Flowchart | Flowchart Design - Symbols, Shapes, Stencils and Icons
- Flowchart | Flow Chart Symbols
- Electrical | Electrical Drawing - Wiring and Circuits Schematics
- Flowchart | Common Flowchart Symbols
- Flowchart | Common Flowchart Symbols