The vector stencils library "Scrum charts" contains 4 templates: release burndown chart, sprint burndown chart, release velocity chart and team velocity chart. Use it to design your agile software development charts and infographics.
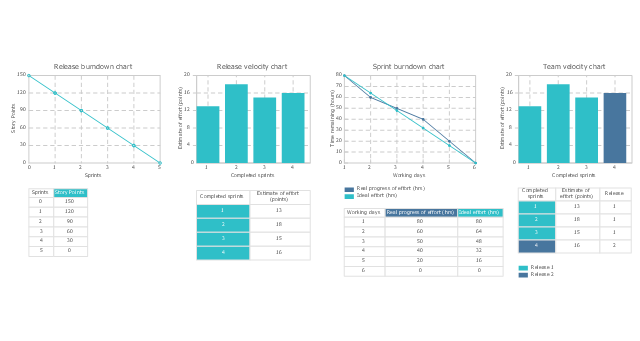
"A burn down chart is a graphical representation of work left to do versus time. The outstanding work (or backlog) is often on the vertical axis, with time along the horizontal. That is, it is a run chart of outstanding work. It is useful for predicting when all of the work will be completed. It is often used in agile software development methodologies such as Scrum. However, burn down charts can be applied to any project containing measurable progress over time.
Outstanding work can be represented in terms of either time or story points." [Burn down chart. Wikipedia]
The burn down and velocity charts sample "Design elements - Scrum charts" is included in the Scrum solution from the Project Management area of ConceptDraw Solution Park.
Burn down and velocity charts
Value stream with ConceptDraw PRO

Scrum process work items and workflow

Scrum workflow

Pictures of Vegetables

ConceptDraw PRO diagramming and vector drawing software extended with Food Court solution from the Food and Beverage area of ConceptDraw Solution Park is perfect food pictures design software.
 ConceptDraw Solution Park
ConceptDraw Solution Park collects graphic extensions, examples and learning materials
ER diagram tool for OS X

IT Security Solutions

 Seven Basic Tools of Quality
Manage quality control in the workplace, using fishbone diagrams, flowcharts, Pareto charts and histograms, provided by the Seven Basic Tools of Quality solution.
 Business Package for Management
Package intended for professional who designing and documenting business processes, preparing business reports, plan projects and manage projects, manage organizational changes, prepare operational instructions, supervising specific department of an organization, workout customer service processes and prepare trainings for customer service personal, carry out a variety of duties to organize business workflow.
- Teams Agile Graphical Representation
- PM Agile | Scrum Workflow | Task Board | Team Velocity Agile ...
- Design elements - Scrum charts | PM Agile | How to Create a ...
- Agile Methodology | Basic Flowchart Symbols and Meaning | Scrum ...
- Design elements - Scrum charts | PM Agile | Scrum process work ...
- SSADM Diagram | Agile Methodology | Scrum process work items ...
- Agile Scrum Ppt
- Scrum process work items and workflow | Agile Methodology ...
- Agile Sprint Diagram
- Agile Workflow Diagram
- Network Topology Illustration | Scrum process work items and ...
- PM Agile | Sprint Planning Meeting Agenda | Scrum Workflow | Agile ...
- Agile Methodology | SSADM Diagram | Scrum process work items ...
- Scrum Diagram Visio Diagram
- Scrum process work items and workflow | Sprint Planning Meeting ...
- Scrum Team Chart
- Scrum
- Construction Project Chart Examples
- SSADM Diagram | Scrum process work items and workflow | How To ...
- Diagram Visio Agile Process
- ERD | Entity Relationship Diagrams, ERD Software for Mac and Win
- Flowchart | Basic Flowchart Symbols and Meaning
- Flowchart | Flowchart Design - Symbols, Shapes, Stencils and Icons
- Flowchart | Flow Chart Symbols
- Electrical | Electrical Drawing - Wiring and Circuits Schematics
- Flowchart | Common Flowchart Symbols
- Flowchart | Common Flowchart Symbols