Taxi Service Data Flow Diagram DFD Example

UML Use Case Diagram Example - Taxi Service

This sample shows the work of the taxi service and is used by taxi stations, by airports, in the tourism field and delivery service.
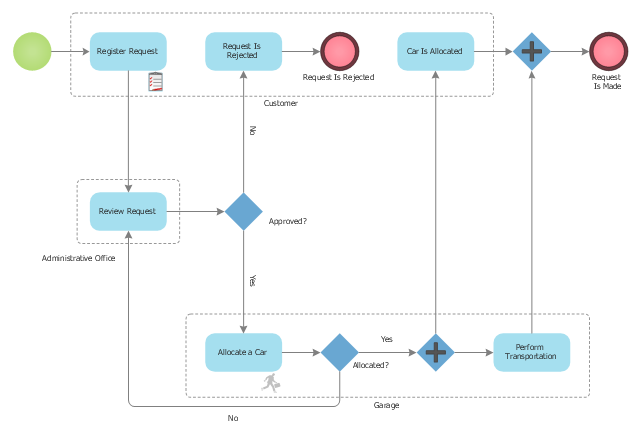
This BPMN (Business Process Model and Notation) diagram sample represents the taxi service order procedure workflow.
"A business process or business method is a collection of related, structured activities or tasks that produce a specific service or product (serve a particular goal) for a particular customer or customers. It often can be visualized with a flowchart as a sequence of activities with interleaving decision points or with a Process Matrix as a sequence of activities with relevance rules based on data in the process. ...
There are three types of business processes:
(1) Management processes, the processes that govern the operation of a system. Typical management processes include "corporate governance" and "strategic management".
(2) Operational processes, processes that constitute the core business and create the primary value stream. Typical operational processes are purchasing, manufacturing, advertising and marketing, and sales.
(3) Supporting processes, which support the core processes. Examples include accounting, recruitment, call center, technical support. ...
The ... improvement areas are equally applicable to policies, processes and detailed procedures (sub-processes/ tasks). There is a cascading effect of improvements made at a higher level on those made at a lower level.
For instance, if a recommendation to replace a given policy with a better one is made with proper justification and accepted in principle by business process owners, then corresponding changes in the consequent processes and procedures will follow naturally in order to enable implementation of the policies" [Business process. Wikipedia]
The business process modeling diagram example "Taxi service order procedure - BPMN 1.2 diagram" was created using the ConceptDraw PRO diagramming and vector drawing software extended with the Business Process Diagram solution from the Business Processes area of ConceptDraw Solution Park.
Business process modeling
Workflow Process Example

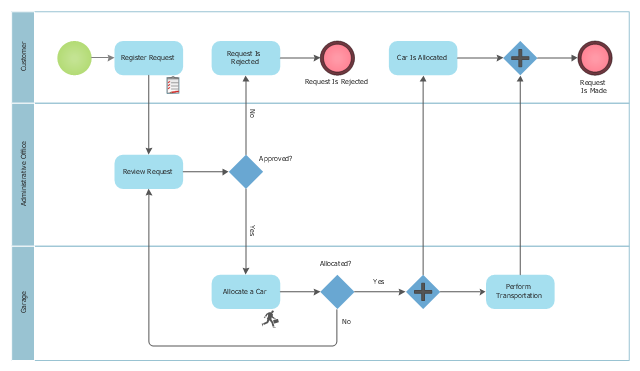
This BPMN (Business Process Model and Notation) diagram sample shows the taxi order process workflow.
"Business process modeling (BPM) in systems engineering is the activity of representing processes of an enterprise, so that the current process may be analyzed and improved. BPM is typically performed by business analysts and managers who are seeking to improve process efficiency and quality. The process improvements identified by BPM may or may not require information technology involvement, although that is a common driver for the need to model a business process, by creating a process master. Business process modeling results in the improvement of the way tasks performed by the business. They can pick up errors or cons about the way processes are currently being performed and model an improved way of carrying out these processes." [Business process modeling. Wikipedia]
The business process modeling diagram example "Taxi order process - BPMN 1.2 diagram" was created using the ConceptDraw PRO diagramming and vector drawing software extended with the Business Process Diagram solution from the Business Processes area of ConceptDraw Solution Park.
Business process modeling
Diagramming Software for Design UML Timing Diagrams


Workflow Diagram

The workflow represents the transferring of data, documents or tasks during a work process. To make it easier to study and analyze working processes, and to present them in a simple visual manner, workflow diagrams are used. To create these diagrams professional use workflow diagram maker software ConceptDraw DIAGRAM.
Polar Graph

UML Class Diagram Example - Buildings and Rooms

This sample shows the structure of the building and can be used by building companies, real estate agencies, at the buying / selling of the realty.
UML 2 4 Process Flow Diagram

Examples of Flowchart

This sample was created in ConceptDraw DIAGRAM diagramming and vector drawing software using the Flowcharts solution from the "Diagrams" area of ConceptDraw Solution Park.

How To Create a Workflow Diagram

The fastest way to create a workflow diagram is using pre-designed workflow template. ConceptDraw DIAGRAM with the Workflow Diagrams solution delivers rich set of workflow diagram templates you may start from.
Workflow Diagram Symbols

UML Software

The Rapid UML Solution for ConceptDraw DIAGRAM presentsthe intuitive RapidDraw interface that helps you to make the UML Diagram of any of these 13 types quick and easy.
Internet Group Management Protocol (IGMP). Computer and Network Examples
. <br>Computer and Network Examples *")
This example was created in ConceptDraw DIAGRAM using the Computer and Networks solution from the Computer and Networks area of ConceptDraw Solution Park. It shows the architecture of the network for delivering a multicast service using IGMP.

Selecting & Creating Flowcharts

Work Flow Diagram

Any flow diagram can be sometimes seen as a counterpart of some flowchart being created with the help of the ConceptDraw DIAGRAM diagramming and drawing software as well as the Workflow Diagrams solution taken from the ConceptDraw STORE application.
Object-Oriented Development (OOD) Method
 Method *")
This sample was created in ConceptDraw DIAGRAM diagramming and vector drawing software using the Rapid UML Solution from the Software Development area of ConceptDraw Solution Park.
Express-G Diagram

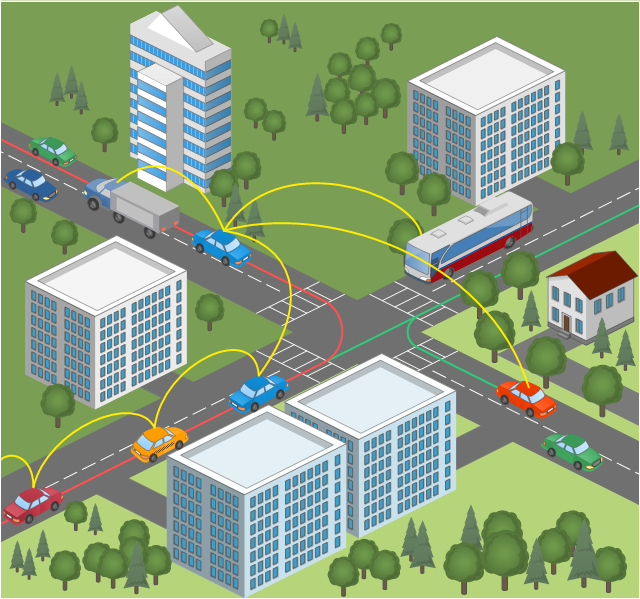
This vehicular network diagram sample was drawn on the base of picture illustrating the post "Intelligent transportation system" from the blog "Technology New Here".
"Intelligent transportation systems are projects that aim to integrate modern communication and information technology into existing transportation management systems in order to optimize vehicle life, fuel efficiency, safety, and traffic in urbanized cities.
The need for intelligent transportation systems stems from the fact that traffic congestion has been increasing all around the world because of increasing population, increasing amount of transportation vehicles and increasing urbanization."
[technologynewhere.wordpress.com/ 2010/ 05/ 12/ intelligent-transportation-system/ ]
The vehicular network diagram example "Intelligent transportation system" was created using the ConceptDraw PRO diagramming and vector drawing software extended with the Vehicular Networking solution from the Computer and Networks area of ConceptDraw Solution Park.
Vehicular network diagram
Used Solutions
- Rapid UML | Cab Management System Class Diagram Explain
- Rapid UML | Rapid UML | Object Diagram For Cab Management ...
- State Machine Diagram Taxi Management
- UML Use Case Diagram Example - Taxi Service | How To Create a ...
- Use Case Diagram For Cab Management System
- Process Flowchart | Cab Management Er Diagram
- Deployment Diagram For Cab Management System
- Diagrams For Cab Management System
- Taxi Service Data Flow Diagram DFD Example | Types of Flowchart ...
- Component And Deployment Diagram For Taxi Service Management
- Actitvity Diagram For Taxi Management System
- E-R Diagrams | Business Process Modeling Notation Template ...
- Taxi Service Data Flow Diagram DFD Example | Social Media ...
- Taxi Service Data Flow Diagram DFD Example | Process Flowchart ...
- Rapid UML | State Machine Diagram For Taxi Business
- Taxi Service Data Flow Diagram DFD Example | UML Use Case ...
- State Chart Diagram Of Cab Management System
- UML Use Case Diagram Example - Taxi Service | Cab booking ...
- Data Flow Diagram Of Online Cab Booking
- Healthcare Management Workflow Diagrams | Service Management ...
- ERD | Entity Relationship Diagrams, ERD Software for Mac and Win
- Flowchart | Basic Flowchart Symbols and Meaning
- Flowchart | Flowchart Design - Symbols, Shapes, Stencils and Icons
- Flowchart | Flow Chart Symbols
- Electrical | Electrical Drawing - Wiring and Circuits Schematics
- Flowchart | Common Flowchart Symbols
- Flowchart | Common Flowchart Symbols