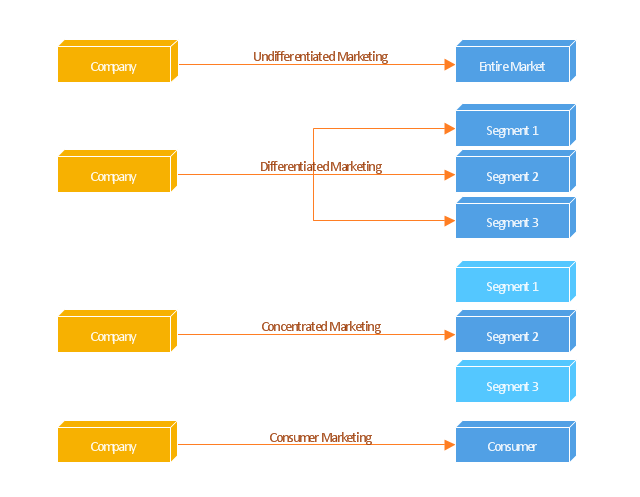
"Targeted advertising is a type of advertising whereby advertisements are placed so as to reach consumers based on various traits such as demographics, psychographics, behavioral variables (such as product purchase history), and firmographic variables ... or other second-order activities which serve as a proxy for these traits.
Most targeted new media advertising currently uses second-order proxies for targeting, such as tracking online or mobile web activities of consumers, associating historical webpage consumer demographics with new consumer web page access, using a search word as the basis for implied interest, or contextual advertising.
Addressable advertising systems serve ads directly based on demographic, psychographic, or behavioral attributes associated with the consumer(s) exposed to the ad. These systems are always digital and must be addressable in that the end point which serves the ad (set-top box, website, or digital sign) must be capable of rendering an ad independently of any other end points based on consumer attributes specific to that end point at the time the ad is served. Addressable advertising systems therefore must use consumer traits associated with the end points as the basis for selecting and serving ads." [Targeted advertising. Wikipedia]
The block diagram example "Marketing targeting" was created using the ConceptDraw PRO diagramming and vector drawing software extended with the Block Diagrams solution from the area "What is a Diagram" of ConceptDraw Solution Park.
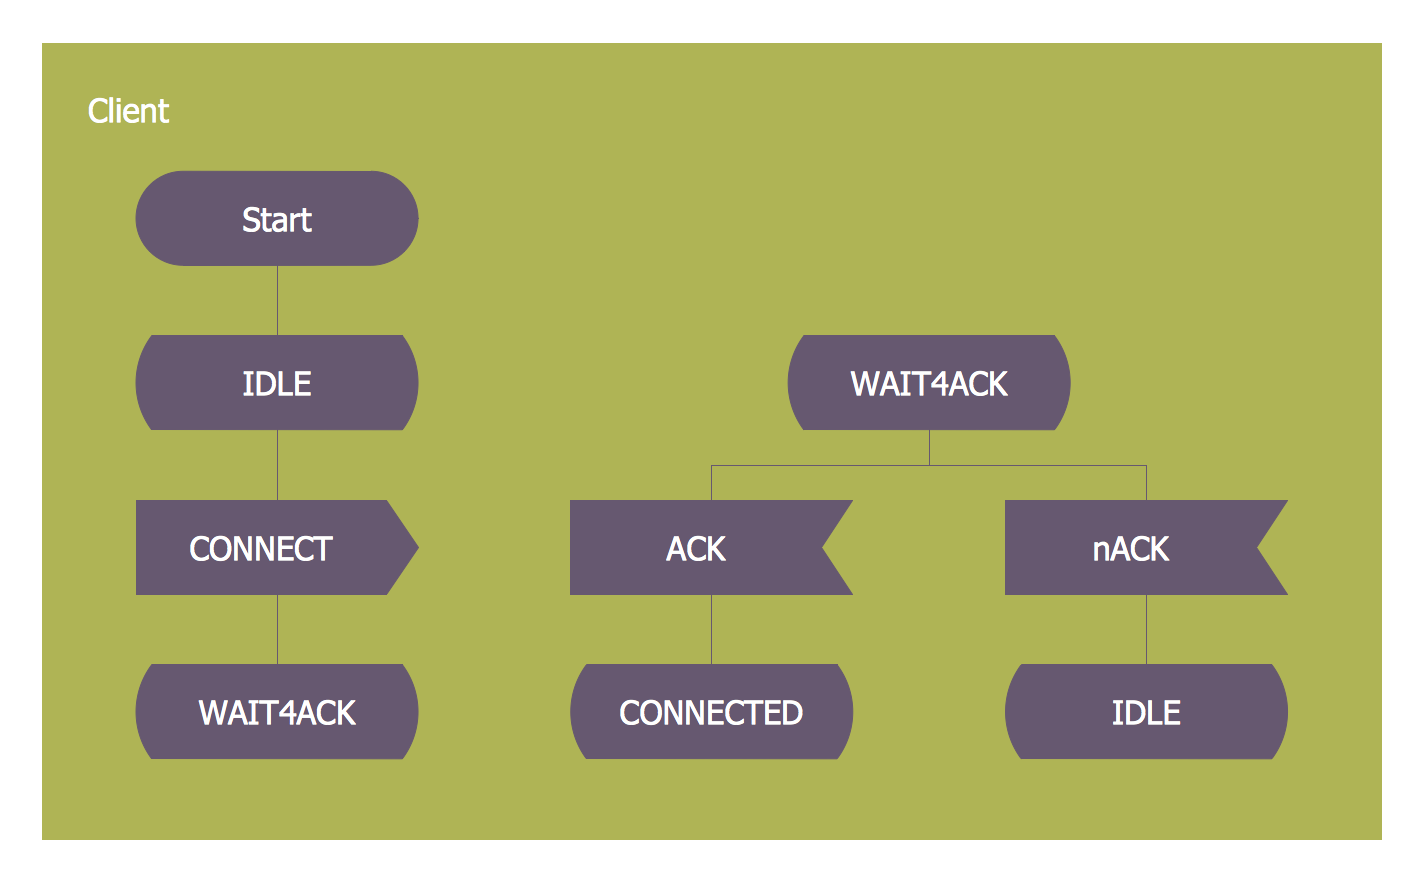
Block diagram
This circular arrows diagram sample shows advanced persistent threat lifecycle.
It was designed on the base of the Wikimedia Commons file: Advanced persistent threat lifecycle.jpg.
[commons.wikimedia.org/ wiki/ File:Advanced_ persistent_ threat_ lifecycle.jpg]
This file is licensed under the Creative Commons Attribution-Share Alike 3.0 Unported license. [creativecommons.org/ licenses/ by-sa/ 3.0/ deed.en]
"Advanced Persistent Threat (APT) APT is a set of stealthy and continuous hacking processes often orchestrated by human targeting a specific entity. APT usually targets organizations and or nations for business or political motives. APT processes require high degree of covertness over a long period of time. As the name implies, APT consists of three major components/ processes: advanced, persistent, and threat. The advanced process signifies sophisticated techniques using malware to exploit vulnerabilities in systems. The persistent process suggests that an external command and control is continuously monitoring and extracting data off a specific target. The threat process indicates human involvement in orchestrating the attack.
APT usually refers to a group, such as a government, with both the capability and the intent to persistently and effectively target a specific entity. The term is commonly used to refer to cyber threats, in particular that of Internet-enabled espionage using a variety of intelligence gathering techniques to access sensitive information, but applies equally to other threats such as that of traditional espionage or attack. Other recognized attack vectors include infected media, supply chain compromise, and social engineering. Individuals, such as an individual hacker, are not usually referred to as an APT as they rarely have the resources to be both advanced and persistent even if they are intent on gaining access to, or attacking, a specific target." [Advanced persistent threat. Wikipedia]
The arrow donut chart example
"Advanced persistent threat lifecycle" was created using the ConceptDraw PRO diagramming and vector drawing software extended with the Circular Arrows Diagrams solution from the area "What is a Diagram" of ConceptDraw Solution Park.
Circular arrows diagram

 Block Diagrams
Block diagrams solution extends ConceptDraw DIAGRAM software with templates, samples and libraries of vector stencils for drawing the block diagrams.
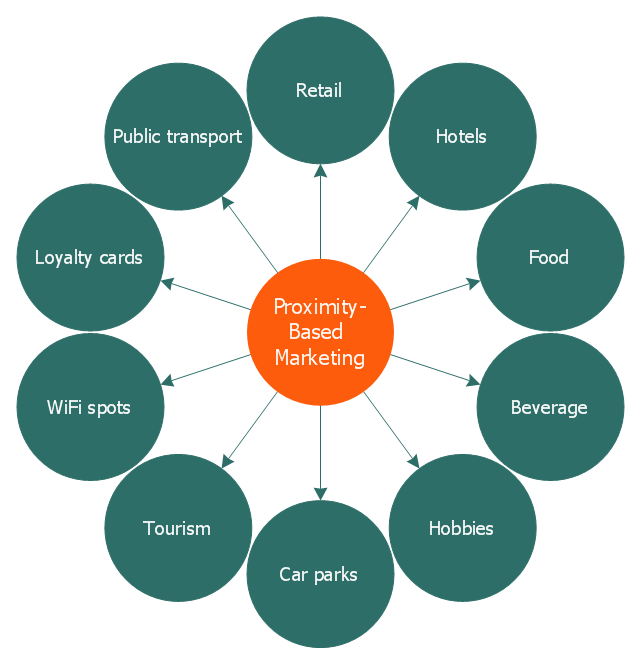
This circle-spoke diagram sample illustrates the proximity marketing.
"Proximity marketing is the localized wireless distribution of advertising content associated with a particular place. Transmissions can be received by individuals in that location who wish to receive them and have the necessary equipment to do so.
Distribution may be via a traditional localized broadcast, or more commonly is specifically targeted to devices known to be in a particular area.
The location of a device may be determined by:
(1) A cellular phone being in a particular cell.
(2) A Bluetooth or WiFi device being within range of a transmitter.
(3) An Internet enabled device with GPS enabling it to request localized content from Internet servers.
(4) A NFC enabled phone can read a RFID chip on a product or media and launch localized content from internet servers.
Communications may be further targeted to specific groups within a given location, for example content in tourist hot spots may only be distributed to devices registered outside the local area.
Communications may be both time and place specific, e.g. content at a conference venue may depend on the event in progress.
Uses of proximity marketing include distribution of media at concerts, information (weblinks on local facilities), gaming and social applications, and advertising." [Proximity marketing. Wikipedia]
The hub-and-spoke diagram example "Proximity based marketing" was created using the ConceptDraw PRO diagramming and vector drawing software extended with the Circle-Spoke Diagrams solution from the area "What is a Diagram" of ConceptDraw Solution Park.
Circle-spoke diagram
This computer security diagram example was designed on the base of the Wikimedia Commons file: Conficker.svg. [commons.wikimedia.org/ wiki/ File:Conficker.svg]
This file is licensed under the Creative Commons Attribution-Share Alike 3.0 Unported license. [creativecommons.org/ licenses/ by-sa/ 3.0/ deed.en]
"A computer worm is a standalone malware computer program that replicates itself in order to spread to other computers. Often, it uses a computer network to spread itself, relying on security failures on the target computer to access it. Unlike a computer virus, it does not need to attach itself to an existing program. Worms almost always cause at least some harm to the network, even if only by consuming bandwidth, whereas viruses almost always corrupt or modify files on a targeted computer." [Computer worm. Wikipedia]
The cybersecurity diagram example "Spread of Conficker worm" was created using the ConceprDraw PRO software extended with the Network Security Diagrams solution from the Computer and Neworks area of ConceptDraw Solution Park.
Computer security diagram

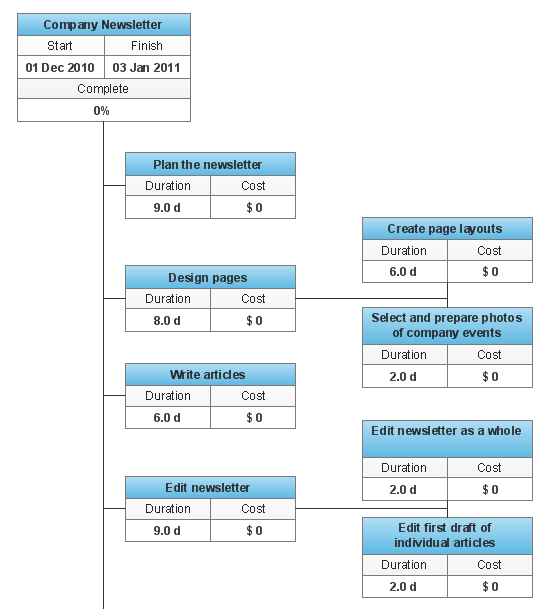
WBS Diagram
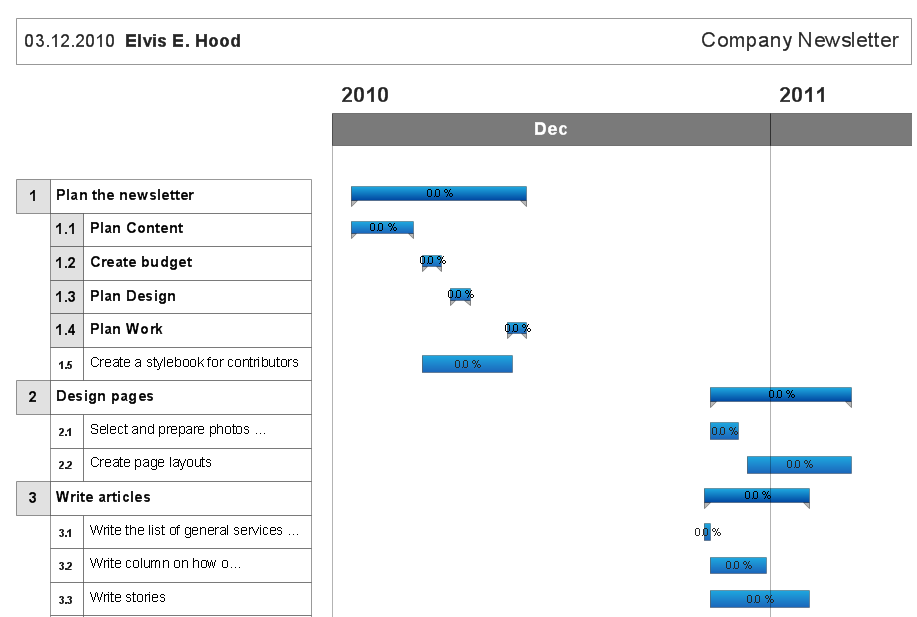
Gantt Chart Diagram
SDL — Systems Engineering
 PM Easy
PM Easy solution extends the ConceptDraw PROJECT functionality with an ability to support neutral methodology of project management and to quickly start a project by listing the task relationships and dependencies, that makes the iterative planning much easier. The project management tool and available visual tools, such as mind mapping, increase the effectiveness of tracking and analysis your project tasks. PM Easy solution from ConceptDraw Solution Park is mainly targeted at project managers in small or medium-sized companies, allowing them to make the project plan and execute projects using mind mapping technique, to implement planning using mind mapping, and to track tasks using ConceptDraw PROJECT application.
 PM Presentations
The PM Presentations solution extends the power of ConceptDraw MINDMAP , ConceptDraw DIAGRAM , and ConceptDraw PROJECT, improving their efficiency at many stages of the project management process by using the same source data to construct the targeted presentation for your audience and clearly communicating the appropriate information to different audiences from a single source. It gives an ability to project managers and other team participants to create and to deliver capacious presentations representing the data and knowledge of a specific project with the help of including visual dashboards, Gantt charts, resource views, maps, timelines, calendars, illustrations, project diagrams and reports of varied types. Having the possibility to edit collaboratively in a Full-Screen Mode, the teams can rapidly plan a project as well as execute the tasks of revising and making changes to it.
Restaurant Floor Plans

This value stream map example was redesigned from the Wikipedia file: ValueStreamMapParts.png.
[en.wikipedia.org/ wiki/ File:ValueStreamMapParts.png]
This file is licensed under the Creative Commons Attribution-Share Alike 3.0 Unported license. [creativecommons.org/ licenses/ by-sa/ 3.0/ deed.en]
"Value stream mapping (VSM) refers to the activity of developing a visual representation of the flow of processes, from start to finish, involved in delivering a desired outcome, service, or product (a “value stream”) that is valued by customers. In the context of government, a value stream could be the process of conducting an audit, completing a procurement, or hiring new agency staff. VSM can increase understanding of actual decision-making processes and identify sources of non-value-added time (e.g., documents waiting to be reviewed). The typical products of a 2-5 day VSM workshop are a map of the “current state” of targeted processes and a “future state” map of the desired process flow and an associated implementation plan for future process improvement activities." [en.wikibooks.org/ wiki/ Business_ Analysis_ Guidebook/ LEAN]
The VSM diagram example "Value stream map parts" was created using the ConceptDraw PRO diagramming and vector drawing software extended with the Value Stream Mapping solution from the Quality area of ConceptDraw Solution Park.
Value stream mapping

- Target Diagram | Target and Circular Diagrams | Block diagram ...
- Marketing Diagrams | Target and Circular Diagrams | Block diagram ...
- Diagram Of Targeted Marketing
- Marketing Diagrams | Marketing mix - Wheel diagram | Block ...
- Block diagram - Marketing targeting
- Block diagram - Marketing targeting | Venn diagram - Internet ...
- Block diagram - Marketing targeting | Targeted Advertising
- Pyramid Diagram | Block diagram - Marketing targeting | Time ...
- Marketing mix - Wheel diagram | Marketing mix diagram | Target ...
- Block diagram - Marketing targeting
- Block diagram - Marketing targeting | Design elements ...
- Pyramid Diagram | Block diagram - Marketing targeting | Time ...
- Block diagram - Marketing targeting | Block diagram - Six markets ...
- ConceptDraw Solution Park | Block diagram - Marketing targeting ...
- ConceptDraw Solution Park | Flow Chart Online | Block diagram ...
- Advertising creation process - Conversation BPMN 2.0 diagram ...
- Block diagram - Marketing targeting | Process Flowchart | Interior ...
- Scatter Chart Examples | Target market | Block diagram - Marketing ...
- Block diagram - Marketing targeting | Competing consumers pattern ...
- Target market | Target Diagram | Circle Spoke Diagram Template ...
- ERD | Entity Relationship Diagrams, ERD Software for Mac and Win
- Flowchart | Basic Flowchart Symbols and Meaning
- Flowchart | Flowchart Design - Symbols, Shapes, Stencils and Icons
- Flowchart | Flow Chart Symbols
- Electrical | Electrical Drawing - Wiring and Circuits Schematics
- Flowchart | Common Flowchart Symbols
- Flowchart | Common Flowchart Symbols