Electrical Symbols — Logic Gate Diagram
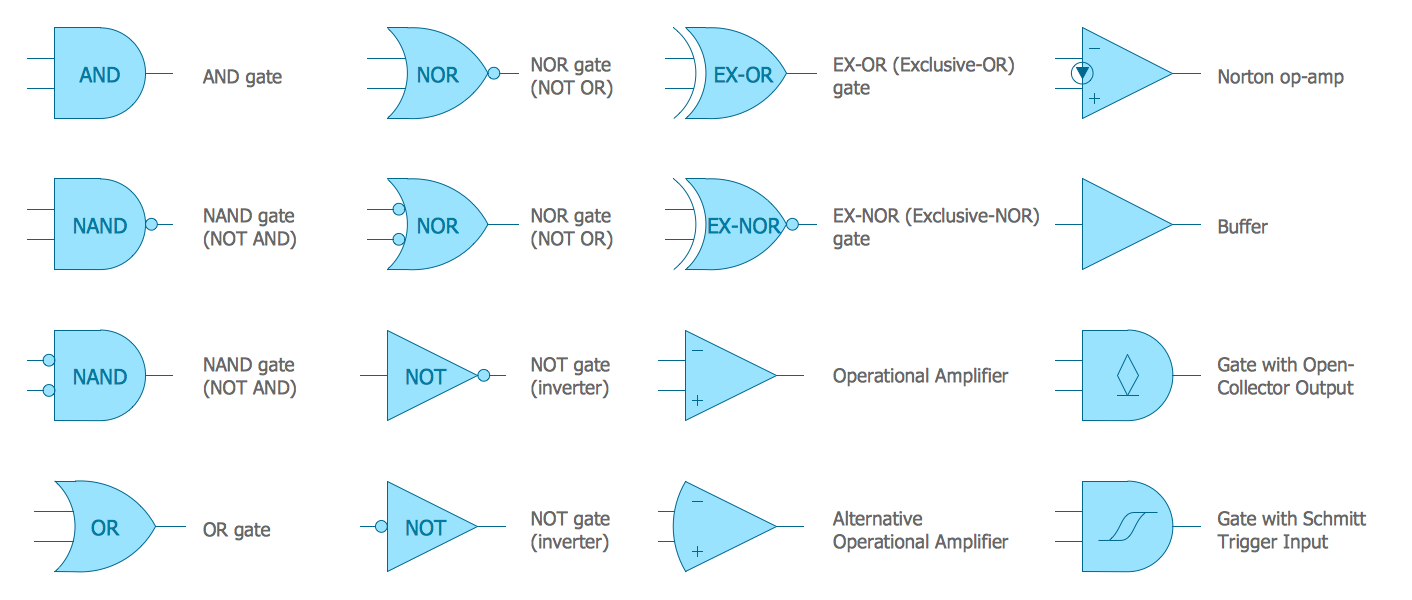
26 libraries of the Electrical Engineering Solution of ConceptDraw DIAGRAM make your electrical diagramming simple, efficient, and effective. You can simply and quickly drop the ready-to-use objects from libraries into your document to create the electrical diagram.
Piping and Instrumentation Diagram Software

Plumbing and Piping Plans solution helps you create quick and easy: key piping and instrument details ,piping diagrams, instrumentation diagrams, schemes of hot and cold water supply systems, control and shutdown schemes, diagrams of plumbing systems, heating schemes, schematics of waste water disposal systems, safety and regulatory requirements, diagrams of ventilation systems, mechanical diagrams, industrial diagrams, basic start up and operational information.
Martin ERD Diagram

Total Quality Management Definition

Chen ERD Diagram

Total Quality Management Value

Sales Process Flowchart. Flowchart Examples

Work Flow Diagram
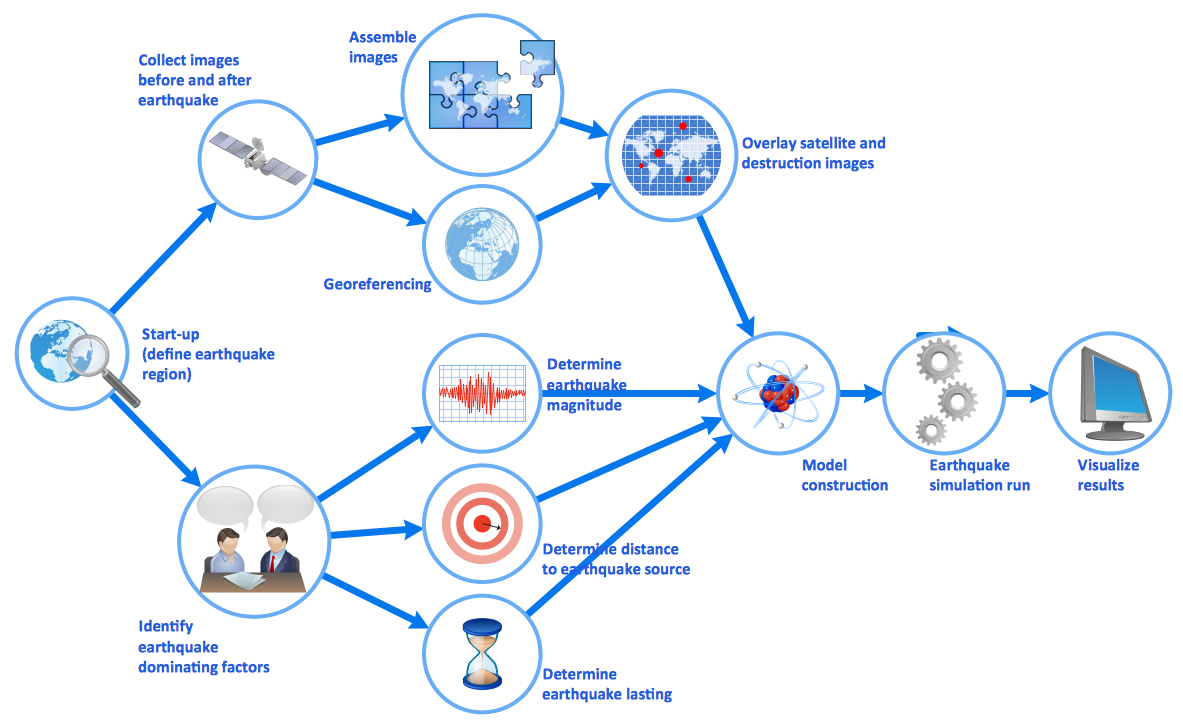
Any flow diagram can be sometimes seen as a counterpart of some flowchart being created with the help of the ConceptDraw DIAGRAM diagramming and drawing software as well as the Workflow Diagrams solution taken from the ConceptDraw STORE application.
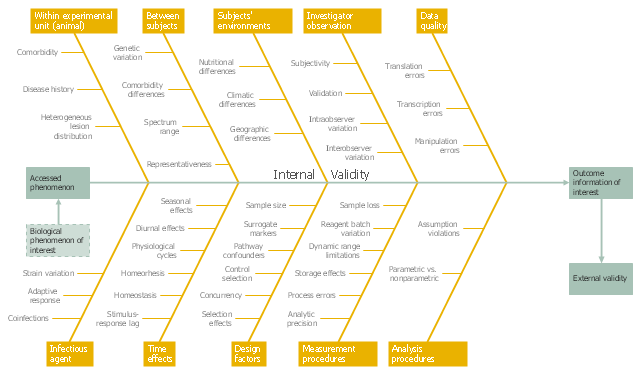
This example was created on the base of the figure from the website of the WSU College of Veterinary Medicine of the Washington State University. [vetmed.wsu.edu/ courses-jmgay/ images/ Ishikawa%20 Variance%20 Diagram.jpg]
"Internal validity is a property of scientific studies which reflects the extent to which a causal conclusion based on a study is warranted. Such warrant is constituted by the extent to which a study minimizes systematic error (or 'bias')." [Internal validity. Wikipedia]
The fishbone diagram example "Ishikawa variance diagram" was created using the ConceptDraw PRO diagramming and vector drawing software extended with the Fishbone Diagrams solution from the Management area of ConceptDraw Solution Park.
Ishikawa diagram
- Systematic Diagram
- Systematic Diagram Of Laboratory Apparatus
- Biology | Biology Drawing | Systematic Diagram Of Glycolysis
- GPRS network diagram | Diagram Of Systematic Gsm
- Draw The Systematic Diagram Of A Beam Balance
- Tree Diagram Or Systematic Diagram Tqm
- Schematic Diagram Of Lab Apparatus
- Process For Systematic Diagram
- Top 5 Android Flow Chart Apps | Contoh Systematic Diagram
- Power Token Systematic Diagram
- ERD | Entity Relationship Diagrams, ERD Software for Mac and Win
- Flowchart | Basic Flowchart Symbols and Meaning
- Flowchart | Flowchart Design - Symbols, Shapes, Stencils and Icons
- Flowchart | Flow Chart Symbols
- Electrical | Electrical Drawing - Wiring and Circuits Schematics
- Flowchart | Common Flowchart Symbols
- Flowchart | Common Flowchart Symbols