 Workflow Diagrams
Workflow Diagrams solution extends ConceptDraw PRO software with samples, templates and vector stencils library for drawing the work process flowcharts.
 Data Flow Diagrams (DFD)
Data Flow Diagrams solution extends ConceptDraw PRO software with templates, samples and libraries of vector stencils for drawing the data flow diagrams (DFD).
 Audit Flowcharts
Audit flowcharts solution extends ConceptDraw PRO software with templates, samples and library of vector stencils for drawing the audit and fiscal flow charts.
 Interactive Voice Response Diagrams
Interactive Voice Response Diagrams solution extends ConceptDraw PRO v10 software with samples, templates and libraries of ready-to-use vector stencils that help create Interactive Voice Response (IVR) diagrams illustrating in details a work of interactive voice response system, the IVR system’s logical and physical structure, Voice-over-Internet Protocol (VoIP) diagrams, and Action VoIP diagrams with representing voice actions on them, to visualize how the computers interact with callers through voice recognition and dual-tone multi-frequency signaling (DTMF) keypad inputs.
 Cross-Functional Flowcharts
Cross-functional flowcharts are powerful and useful tool for visualizing and analyzing complex business processes which requires involvement of multiple people, teams or even departments. They let clearly represent a sequence of the process steps, the order of operations, relationships between processes and responsible functional units (such as departments or positions).
HelpDesk
How to Create a Data Flow Diagram using ConceptDraw PRO
 example")
This TQM diagram example was redesigned from the illustration of the Highway Performance Monitoring System (HPMS) Field Manual from the website of the Federal Highway Administration (FHWA).
[fhwa.dot.gov/ policyinformation/ hpms/ fieldmanual/ chapter7.cfm]
"Highway Performance Monitoring System (HPMS).
The HPMS is a national level highway information system that includes data on the extent, condition, performance, use and operating characteristics of the nation's highways. The HPMS contains administrative and extent of system information on all public roads, while information on other characteristics is represented in HPMS as a mix of universe and sample data for arterial and collector functional systems. Limited information on travel and paved miles is included in summary form for the lowest functional systems.
HPMS was developed in 1978 as a continuing database, replacing the special biennial condition studies that had been conducted since 1965. The HPMS has been modified several times since its inception. Changes have been made to reflect changes in the highway systems, legislation, and national priorities, to reflect new technology, and to consolidate or streamline reporting requirements." [fhwa.dot.gov/ policyinformation/ hpms.cfm]
The TQM flowchart example "Software workflow diagram" was created using the ConceptDraw PRO diagramming and vector drawing software extended with the Total Quality Management (TQM) Diagrams solution from the Quality area of ConceptDraw Solution Park.
TQM diagram

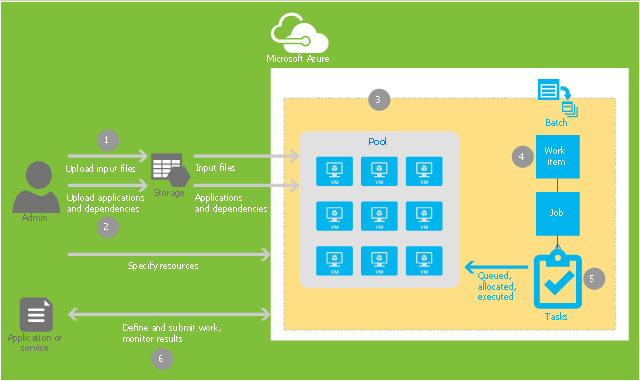
This example of cloud computing system architecture diagram was created on base of the figure "Workflow to distribute workitems to pooled VMs" in the article "Azure Batch technical overview" from the Microsoft Azure website.
"Workitems workflow.
Figure 4 shows a you how to submit an application to a pool where it's distributed for processing. This uses the Batch API. ...
1. Upload input files (such as source data or images) required for a job to an Azure storage account. These files must be in the storage account so that the Batch service can access them. The Batch service loads them onto a TVM when the task runs.
2. Upload the dependent binary files to the storage account. The binary files include the program that is run by the task and the dependent assemblies. These files must also be accessed from storage and are loaded onto the TVM.
3. Create a pool of TVMs, specifying the size of the TVMs in the pool, the OS they run, and other properties. When a task runs, it is assigned a TVM from this pool.
4. Create a workitem. A job will be automatically created when you create a workitem. A workitem enables you to manage a job of tasks.
5. Add tasks to the job. Each task uses the program that you uploaded to process information from a file you uploaded.
6. Run the application and monitor the results of the output." [azure.microsoft.com/ en-us/ documentation/ articles/ batch-technical-overview/ ]
The diagram example "Workitems workflow diagram" was created using ConceptDraw PRO diagramming and vector drawing software extended with the Azure Architecture solution from the Computer and Networks area of ConceptDraw Solution Park.
Cloud computing system architecture diagram
- Process Flowchart | Data Flow Diagram | Basic Flowchart Symbols ...
- Flow chart Example . Warehouse Flowchart | Workflow Diagrams ...
- Workflow Diagram | Account Flowchart Stockbridge System ...
- Account Flow Chart Sample
- TQM Diagram Example | TQM diagram example | Software workflow ...
- Process Flowchart | Account Flowchart Stockbridge System ...
- System Workflow Diagram
- Data Flow Diagram
- Sample Workflow Diagram For Manufacoring System
- Accounting Information Systems Flowchart Example
- Document Management System Workflow Diagram
- System Organisation Design Using Dfd
- Accounting Flowcharts | Purchase Process Flow Chart , Receiving ...
- Flow chart Example . Warehouse Flowchart | Plant Layout Plans ...
- Prosess Of Production System Flow Chart
- Block diagram - Document management system architecture | Block ...
- Cross-Functional Flowchart (Swim Lanes) | Swim Lane Diagrams ...
- Data Flow Diagram With Easy Business Example
- UML Deployment Diagram Example - ATM System | Workflow ...
- UML Diagram | Computer Network Diagrams | AWS Architecture ...
- ERD | Entity Relationship Diagrams, ERD Software for Mac and Win
- Flowchart | Basic Flowchart Symbols and Meaning
- Flowchart | Flowchart Design - Symbols, Shapes, Stencils and Icons
- Flowchart | Flow Chart Symbols
- Electrical | Electrical Drawing - Wiring and Circuits Schematics
- Flowchart | Common Flowchart Symbols
- Flowchart | Common Flowchart Symbols