Data Flow Diagram Process

"Data flow diagrams are one of the three essential perspectives of the structured-systems analysis and design method SSADM. The sponsor of a project and the end users will need to be briefed and consulted throughout all stages of a system's evolution. With a data flow diagram, users are able to visualize how the system will operate, what the system will accomplish, and how the system will be implemented. The old system's dataflow diagrams can be drawn up and compared with the new system's data flow diagrams to draw comparisons to implement a more efficient system. Data flow diagrams can be used to provide the end user with a physical idea of where the data they input ultimately has an effect upon the structure of the whole system from order to dispatch to report. How any system is developed can be determined through a data flow diagram model.
In the course of developing a set of levelled data flow diagrams the analyst/ designers is forced to address how the system may be decomposed into component sub-systems, and to identify the transaction data in the data model.
Data flow diagrams can be used in both Analysis and Design phase of the SDLC.
There are different notations to draw data flow diagrams (Yourdon & Coad and Gane & Sarson), defining different visual representations for processes, data stores, data flow, and external entities." [Data flow diagram. Wikipedia]
The DFD (Yourdon and Coad notation) example "Process of account receivable" was created using the ConceptDraw PRO diagramming and vector drawing software extended with the Data Flow Diagrams solution from the Software Development area of ConceptDraw Solution Park.
Data Flow Diagram

Software Defined Networking System Overview
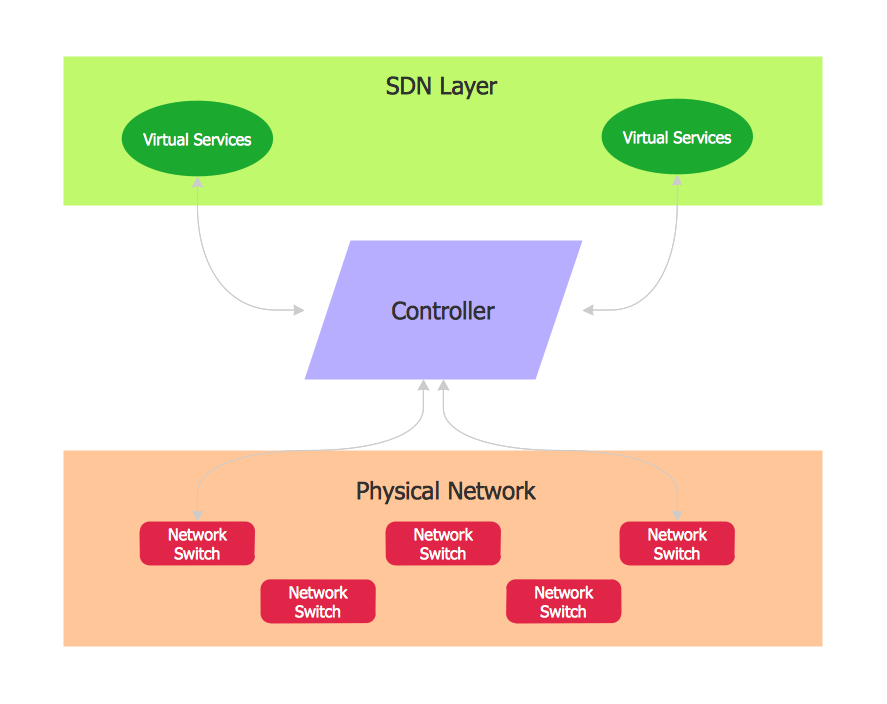
On this example you can see the Software-Defined Networking (SDN) diagram that was created in ConceptDraw DIAGRAM using the Computer and Networks Area of ConceptDraw Solution Park.

Pyramid Diagram

 Venn Diagrams
Venn Diagrams are actively used to illustrate simple set relationships in set theory and probability theory, logic and statistics, mathematics and computer science, linguistics, sociology, and marketing. Venn Diagrams are also often used to visually summarize the status and future viability of a project.
Sketching Software

 Audio, Video, Media
Use it to make professional-looking documents, impressive presentations, and efficient websites with colorful and vivid illustrations and schematics of digital audio, video and photo gadgets and devices, audio video connections and configurations, S Video connection, HD and 3D television systems, home entertainment systems, Closed-circuit television (CCTV) surveillance systems. All audio video schematics, drawings and illustrations designed in ConceptDraw DIAGRAM are professional looking, clear and understandable for all thanks to applying the most commonly used standards of designations, and are effective for demonstrating in front of a small audience and on the big screens.
Scientific Symbols Chart

Mathematics Solution from the Science and Education area of ConceptDraw Solution Park includes a few shape libraries of plane, solid geometric figures, trigonometrical functions and greek letters to help you create different professional looking mathematic illustrations for science and education.
 Basic Line Graphs
This solution extends the capabilities of ConceptDraw DIAGRAM (or later) with templates, samples and a library of vector stencils for drawing Line Graphs.
Project Timeline

You need to make professional looking project timeline? Create it with ConceptDraw DIAGRAM! ConceptDraw DIAGRAM extended with Timeline Diagrams Solution from the Management Area is the best timeline diagrams software
Chart Maker for Presentations

Concept Maps

ConceptDraw DIAGRAM diagramming and vector drawing software extended with Concept Maps Solution from the "Diagrams" Area is effective tool for creating professional looking Concept Maps.
Pictures of Graphs

- System Evolution Diagram With Process
- Data Flow Diagram Process | Line Chart Examples | Line Graphs ...
- Data Flow Diagram Process
- Data Flow Diagram Process | DFD - Process of account receivable ...
- DFD - Process of account receivable | Class UML Diagram for Bank ...
- Data Flow Diagram Process | Why Flowchart Important to ...
- Circular Flow Diagram Template | Data Flow Diagram Process | DFD ...
- Process Context Diagram
- Data Flow Diagram Process | Introduction to bookkeeping ...
- Data Flow Diagram Process | How to Create Flowcharts for an ...
- DFD - Process of account receivable | Rapid UML | Flow Chart Of ...
- Data Flow Diagram Process | DFD - Process of account receivable ...
- Structured Systems Analysis and Design Method (SSADM) with ...
- Data Flow Diagram Process | DFD - Process of account receivable ...
- Accounts Receivable Collection Process Flow Chart
- DFD - Process of account receivable | Data Flow Diagram Process ...
- Data Flow Diagram Process | Flow chart Example. Warehouse ...
- DFD - Process of account receivable | Data Flow Diagram | Data ...
- Dispatch Process Flow Chart
- DFD - Process of account receivable | Accounting Flowchart ...
- ERD | Entity Relationship Diagrams, ERD Software for Mac and Win
- Flowchart | Basic Flowchart Symbols and Meaning
- Flowchart | Flowchart Design - Symbols, Shapes, Stencils and Icons
- Flowchart | Flow Chart Symbols
- Electrical | Electrical Drawing - Wiring and Circuits Schematics
- Flowchart | Common Flowchart Symbols
- Flowchart | Common Flowchart Symbols