Context Diagram Template

This template shows the Context Diagram. It was created in ConceptDraw DIAGRAM diagramming and vector drawing software using the Block Diagrams Solution from the “Diagrams” area of ConceptDraw Solution Park.
The context diagram graphically identifies the system. external factors, and relations between them. It’s a high level view of the system. The context diagrams are widely used in software engineering and systems engineering for designing the systems that process the information.
Block Diagram

Use the libraries from the Block Diagrams solution to draw block diagrams for your business documents, presentations and websites in a few minutes.
Functional Flow Block Diagram

Functional Block Diagram

Software Diagram Examples and Templates

Software Development area of ConceptDraw Solution Park provides 5 solutions:
Data Flow Diagrams, Entity-Relationship Diagram (ERD), Graphic User Interface, IDEFO Diagrams, Rapid UML.
Software Diagram Templates

The Software Diagrams designed with ConceptDraw DIAGRAM are vector graphic documents and are available for reviewing, modifying, converting to a variety of formats (image, HTML, PDF file, MS PowerPoint Presentation, Adobe Flash or MS Visio XML), printing and send via e-mail in one moment.
Create Block Diagram

Create block diagrams, electrical circuit diagrams, schematics, and more in minutes with ConceptDraw DIAGRAM.
Block Diagram Creator

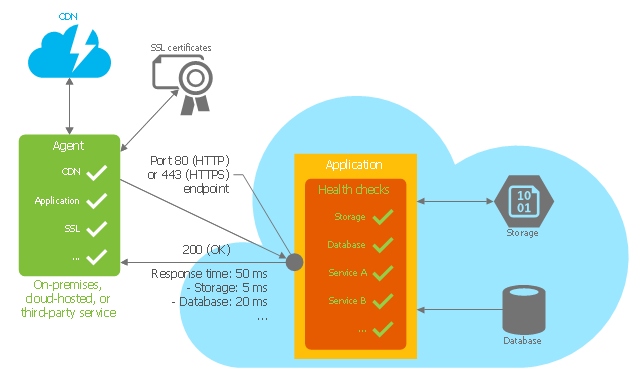
This Azure cloud architecture pattern diagram template was created on the base of figure in the article "Health Endpoint Monitoring Pattern" from the Microsoft Developer Network (MSDN) website.
"Health Endpoint Monitoring Pattern.
Implement functional checks within an application that external tools can access through exposed endpoints at regular intervals. This pattern can help to verify that applications and services are performing correctly. ...
It is good practice—and often a business requirement—to monitor web applications, and middle-tier and shared services, to ensure that they are available and performing correctly. However, it is more difficult to monitor services running in the cloud than it is to monitor on-premises services. ...
Implement health monitoring by sending requests to an endpoint on the application. The application should perform the necessary checks, and return an indication of its status.
A health monitoring check typically combines two factors: the checks (if any) performed by the application or service in response to the request to the health verification endpoint, and analysis of the result by the tool or framework that is performing the health verification check. The response code indicates the status of the application and, optionally, any components or services it uses. The latency or response time check is performed by the monitoring tool or framework." [msdn.microsoft.com/ ru-RU/ library/ dn589789.aspx]
The Azure cloud system architecture diagram template "Health endpoint monitoring pattern" for the ConceptDraw PRO diagramming and vector drawing software is included in the Azure Architecture solutin from the Computer and Networks area of ConceptDraw Solution Park.
Cloud computing system architecture diagram template
Network Diagram Template

UML Block Diagram

This sample shows the work of the taxi service and is used by taxi stations, by airports, in the tourism field and delivery service.
 Interactive Voice Response Diagrams
Interactive Voice Response Diagrams solution extends ConceptDraw DIAGRAM software with samples, templates and libraries of ready-to-use vector stencils that help create Interactive Voice Response (IVR) diagrams illustrating in details a work of interactive voice response system, the IVR system’s logical and physical structure, Voice-over-Internet Protocol (VoIP) diagrams, and Action VoIP diagrams with representing voice actions on them, to visualize how the computers interact with callers through voice recognition and dual-tone multi-frequency signaling (DTMF) keypad inputs.
Technical Flow Chart

Technical Flow Chart can be drawn by pencil on the paper, but it will be easier to use for designing a special software. ConceptDraw DIAGRAM diagramming and vector drawing software extended with Flowcharts Solution from the "Diagrams" Area of ConceptDraw Solution Park will be useful for this goal.
Local area network (LAN). Computer and Network Examples
 diagram")
ConceptDraw - Perfect Network Diagramming Software with examples of LAN Diagrams. ConceptDraw Network Diagram is ideal for network engineers and network designers who need to draw Local Area Network diagrams.

 Block Diagrams
Block diagrams solution extends ConceptDraw DIAGRAM software with templates, samples and libraries of vector stencils for drawing the block diagrams.
IDEF0 Visio

HelpDesk
How to Create a Functional Flow Block Diagram

Use Case Diagrams technology with ConceptDraw DIAGRAM

UML Composite Structure Diagram


Block Diagram Software

- Use Microsoft Visio To Draw Control System Block Diagram
- Context Diagram Template | Block Diagram | Functional Flow Block ...
- How To Draw Block Diagram In Microsoft Powerpoint
- Block diagram - Automotive HVAC system | Functional Block ...
- How to Add a Block Diagram to a MS Word ™ Document Using ...
- Process Flowchart | Block Diagrams | Context Diagram Template ...
- Block diagram - Automotive HVAC system | Interactive voice ...
- Functional Flow Block Diagram | 3D Block diagram - Template ...
- Sample Of A Block Diagram Of A Library System
- Process Flowchart | Context Diagram Template | Block Diagram ...
- Process Flowchart | DFD Library System | Context Diagram ...
- Quality Management System | Process Flowchart | Identifying Quality ...
- System Block Diagram Visio
- Control System Block Diagram Drawing Software
- Context Diagram Template | EPC diagram - Template | Audiovisual ...
- IDEF0 diagram template | Process Flowchart | Functional Flow Block ...
- Draw System Block Diagram Software
- Functional Block Diagram | Context Diagram Template | Process ...
- Basic Diagramming | Block Diagram | Create Block Diagram ...
- Telecommunication Network Diagrams | UML Block Diagram | Block ...
- ERD | Entity Relationship Diagrams, ERD Software for Mac and Win
- Flowchart | Basic Flowchart Symbols and Meaning
- Flowchart | Flowchart Design - Symbols, Shapes, Stencils and Icons
- Flowchart | Flow Chart Symbols
- Electrical | Electrical Drawing - Wiring and Circuits Schematics
- Flowchart | Common Flowchart Symbols
- Flowchart | Common Flowchart Symbols