Sentence Diagram
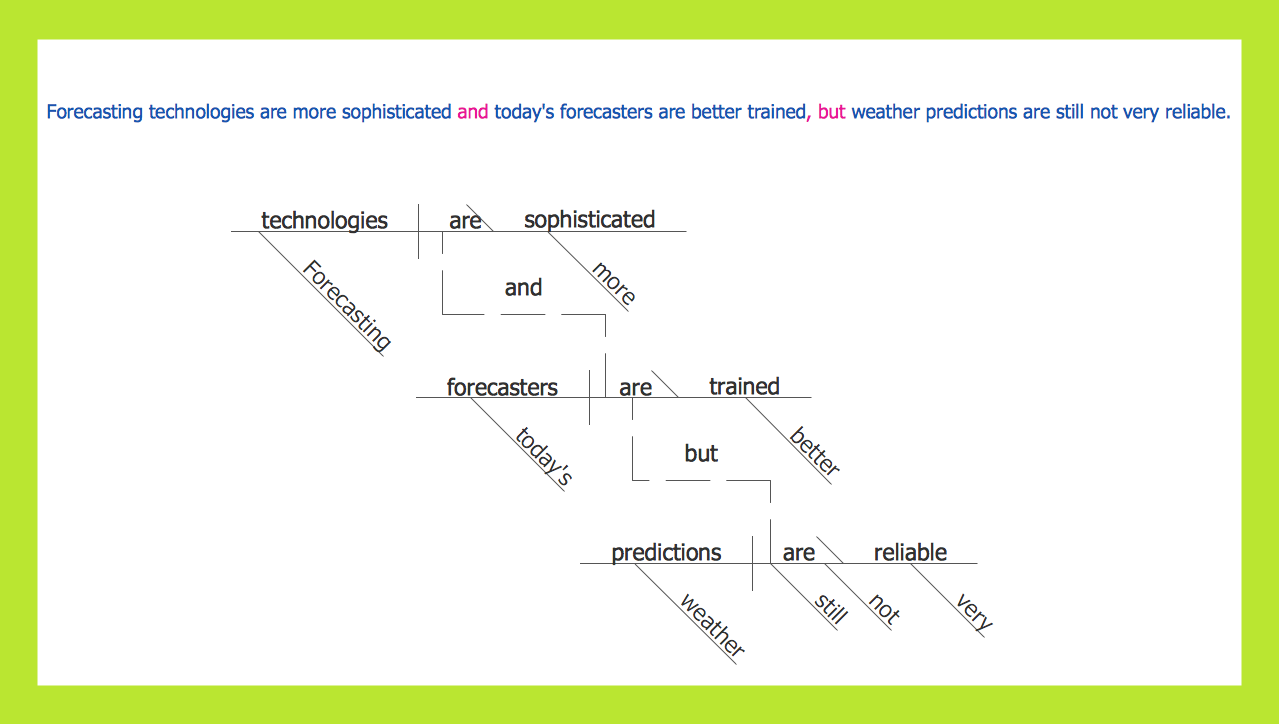
ConceptDraw DIAGRAM diagramming and vector drawing software extended with Language Learning solution from the Science and Education area is ideal for quick and easy drawing sentence diagrams of any complexity.
Sentence Diagrammer

 Language Learning
Language Learning solution extends ConceptDraw DIAGRAM software with templates, samples and library of vector stencils for drawing the sentence diagrams.
ERD Symbols and Meanings

The Chen's ERD notation is still used and is considered to present a more detailed way of representing entities and relationships.
To create an ERD, software engineers mainly turn to dedicated drawing software, which contain the full notation resources for their specific database design - ERD symbols and meanings. CS Odessa has released an all-inclusive Entity-Relationship Diagram (ERD) solution for their powerful drawing program, ConceptDraw DIAGRAM.

Pyramid Diagram

Venn Diagram Examples for Problem Solving. Computer Science. Chomsky Hierarchy

The Venn diagram example below visualizes the the class of language inclusions described by the Chomsky hierarchy.
- Free Sentence Diagrammer | Sentence Diagram | Syntax Tree ...
- Sentence Tree Diagram Generator Online
- Tree Diagram Linguistics Generator
- Entity-Relationship Diagram (ERD) | Online Sentence Tree Maker
- Tree Diagram Generator Online Free
- Syntax Tree Diagram Generator Online Free
- Grammar Tree Diagram Generator Online
- Syntax Tree Diagram Generator Online
- Syntax Tree Diagram Generator
- Linguistics Tree Diagram Generator
- ERD | Entity Relationship Diagrams, ERD Software for Mac and Win
- Flowchart | Basic Flowchart Symbols and Meaning
- Flowchart | Flowchart Design - Symbols, Shapes, Stencils and Icons
- Flowchart | Flow Chart Symbols
- Electrical | Electrical Drawing - Wiring and Circuits Schematics
- Flowchart | Common Flowchart Symbols
- Flowchart | Common Flowchart Symbols