HelpDesk
How to Create Flowchart Using Standard Flowchart Symbols

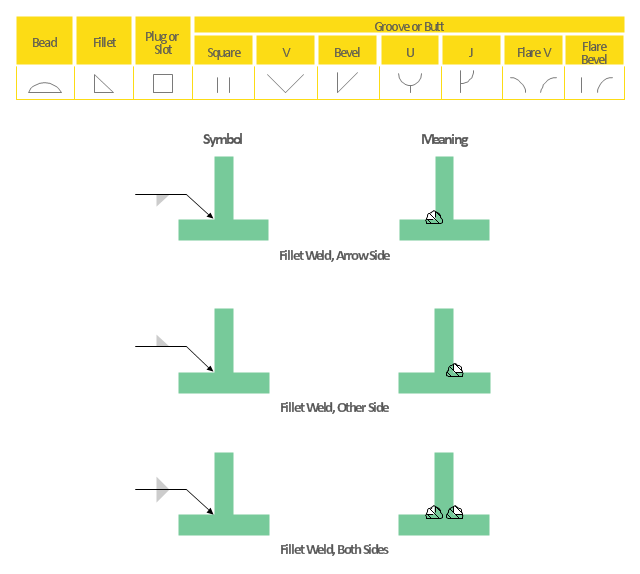
This engineering drawing present weld type symbols and fillet weld symbols.
The weld type symbol is typically placed above or below the center of the reference line, depending on which side of the joint it's on. The symbol is interpreted as a simplified cross-section of the weld.
"Fillet welding refers to the process of joining two pieces of metal together whether they be perpendicular or at an angle. These welds are commonly referred to as Tee joints which are two pieces of metal perpendicular to each other or Lap joints which are two pieces of metal that overlap and are welded at the edges. The weld is aesthetically triangular in shape and may have a concave, flat or convex surface depending on the welder’s technique. Welders use fillet welds when connecting flanges to pipes, welding cross sections of infrastructure, and when fastening metal by bolts isn't strong enough." [Fillet weld. Wikipedia]
The engineering drawing example Welding symbols is included in the Mechanical Engineering solution from Engineering area of ConceptDraw Solution Park.
Welding joint symbols
HelpDesk
How to Create a Timeline Diagram in ConceptDraw PRO

- Mechanical Drawing Symbols | Mechanical Engineering | Elements ...
- How To use Furniture Symbols for Drawing Building Plan | Building ...
- Data Flow Diagram Symbols . DFD Library | Entity Relationship ...
- How To use Furniture Symbols for Drawing Building Plan | Building ...
- How To use Furniture Symbols for Drawing Building Plan | How To ...
- How To use Furniture Symbols for Drawing Building Plan | Cisco ...
- CAD Drawing Software for Making Mechanic Diagram and Electrical ...
- Elements location of a welding symbol | Building Drawing
- Designing Drawing Symbol
- Design elements - Appliances | Built In Stove Symbol In Drawing
- Quality Drawing Symbol
- How To use Furniture Symbols for Drawing Building Plan | How to ...
- How To use Furniture Symbols for Drawing Building Plan | Building ...
- Landscape Architecture Drawing Symbols
- Electrical Drawing Software | Design elements - Electrical circuits ...
- Basic Flowchart Symbols and Meaning | Flowchart design ...
- How To use Furniture Symbols for Drawing Building Plan | Building ...
- Design elements - Bearings | Mechanical Drawing Symbols ...
- Mechanical Engineering | Technical drawing - Machine parts ...
- Technical Drawing Symbol Chart
- ERD | Entity Relationship Diagrams, ERD Software for Mac and Win
- Flowchart | Basic Flowchart Symbols and Meaning
- Flowchart | Flowchart Design - Symbols, Shapes, Stencils and Icons
- Flowchart | Flow Chart Symbols
- Electrical | Electrical Drawing - Wiring and Circuits Schematics
- Flowchart | Common Flowchart Symbols
- Flowchart | Common Flowchart Symbols