 Interactive Voice Response Diagrams
Interactive Voice Response Diagrams solution extends ConceptDraw DIAGRAM software with samples, templates and libraries of ready-to-use vector stencils that help create Interactive Voice Response (IVR) diagrams illustrating in details a work of interactive voice response system, the IVR system’s logical and physical structure, Voice-over-Internet Protocol (VoIP) diagrams, and Action VoIP diagrams with representing voice actions on them, to visualize how the computers interact with callers through voice recognition and dual-tone multi-frequency signaling (DTMF) keypad inputs.
HelpDesk
How to Create an Electrical Diagram

The ability to create electrical diagrams and schematic using ConceptDraw DIAGRAM is delivered by the Electrical Engineering solution. The solution supplied with samples, templates, and libraries of design elements for drawing electrical schematics, digital and analog logic, circuit and wiring schematics and diagrams, power systems diagrams, maintenance and repair diagrams for electronics and electrical engineering.
 ConceptDraw Solution Park
ConceptDraw Solution Park collects graphic extensions, examples and learning materials
HelpDesk
How to Create an IDEF0 Diagram for an Application Development

HelpDesk
How to Create a Rack Diagram

 Crystal Mapping
With Crystal Mapping all goals and relevant information can be observed in one radiant dashboard.
 Bar Graphs
The Bar Graphs solution enhances ConceptDraw DIAGRAM functionality with templates, numerous professional-looking samples, and a library of vector stencils for drawing different types of Bar Graphs, such as Simple Bar Graph, Double Bar Graph, Divided Bar Graph, Horizontal Bar Graph, Vertical Bar Graph, and Column Bar Chart.
HelpDesk
How To Create Root Cause Analysis Diagram Using Solutions

 Fishbone Diagram
Fishbone Diagrams solution extends ConceptDraw DIAGRAM software with templates, samples and library of vector stencils for drawing the Ishikawa diagrams for cause and effect analysis.
HelpDesk
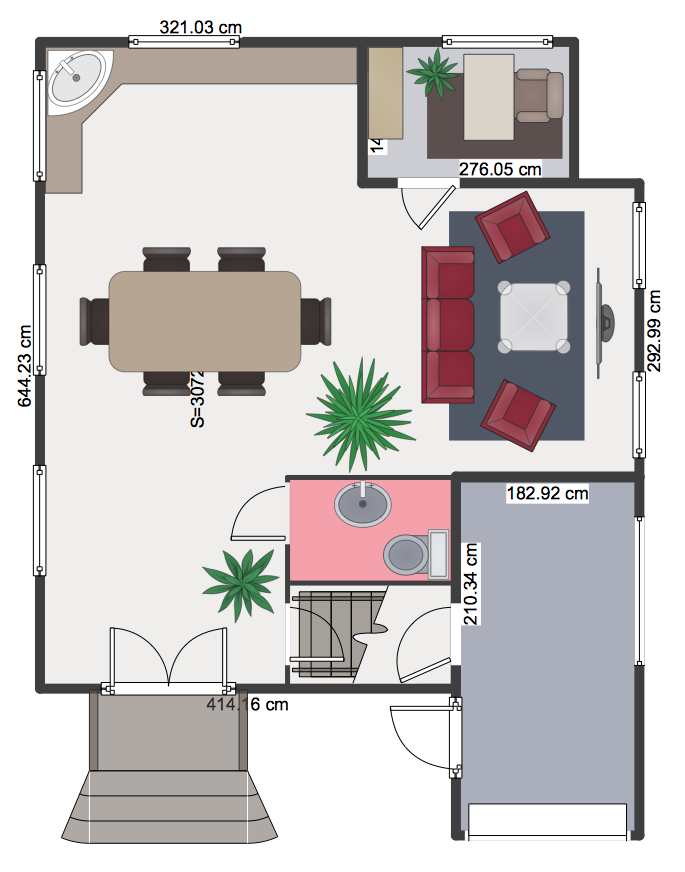
How to Draw a Floor Plan for Your Office

HelpDesk
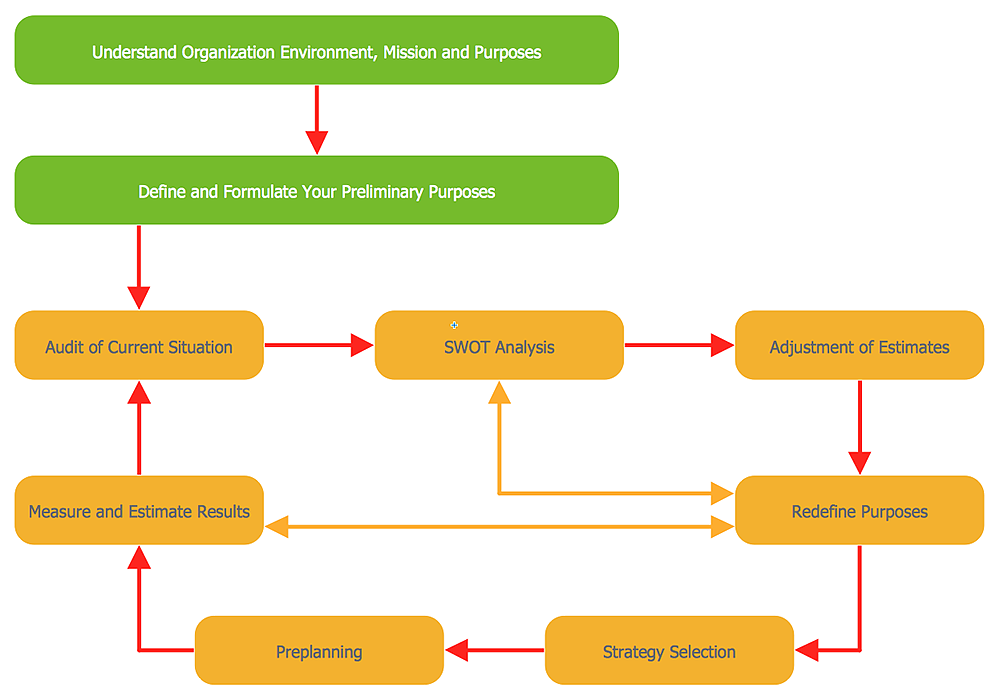
How to Draw a Circular Arrows Diagram

HelpDesk
How to Start Drawing a Diagram on Mac
There are many types of diagrams, you can create using ConceptDraw DIAGRAM: network diagrams, organizational charts, flowcharts, workflow diagrams, technical schemes, and building plans. However, there are the same basic steps to start creating almost all of them. Here the tutorial we will show how to create a simple chart using a template, and how to add shapes to your drawing using libraries.
In this tutorial, we will explain how to create a simple chart in ConceptDraw DIAGRAM using a template, and how to use the library objects.
ConceptDraw DIAGRAM Compatibility with MS Visio

HelpDesk
How to Create a Floor Plan
 Fault Tree Analysis Diagrams
This solution extends ConceptDraw DIAGRAM.5 or later with templates, fault tree analysis example, samples and a library of vector design elements for drawing FTA diagrams (or negative analytical trees), cause and effect diagrams and fault tree diagrams.
- Entity-Relationship Diagram (ERD) | Value Stream Mapping | Crystal ...
- SWOT analysis Software & Template for Macintosh and Windows ...
- Collaboration Area | Word Exchange | SWOT Sample in Computers ...
- How to Draw a Bubble Chart | SWOT analysis positioning matrix ...
- SWOT Analysis | Remote Projects in Corporate Strategy | Business ...
- SWOT Analysis Solution - Strategy Tools | Remote Projects in ...
- Remote Projects in Corporate Strategy | Balanced scorecard ...
- SWOT Analysis Solution - Strategy Tools | Ice Hockey Diagram ...
- Word Exchange | SWOT analysis Software & Template for Macintosh ...
- Diagram Software - The Best Choice for Diagramming | SWOT ...
- Porter's Value Chain | How to Make SWOT Analysis in a Word ...
- SWOT analysis for a small independent bookstore | SWOT Matrix ...
- SWOT Analysis Solution - Strategy Tools | Ice Hockey Diagram ...
- Successful Strategic Plan | SWOT Matrix Template | Stakeholder ...
- SWOT Analysis Solution - Strategy Tools | Basketball Plays ...
- Process Flowchart | Pyramid Chart Examples | How to Draw an ...
- SWOT Analysis Solution - Strategy Tools | Four-quadrant matrix ...
- Sales Process Map | Cross-Functional Flowcharts | SWOT Analysis ...
- Looking at ConceptDraw MINDMAP as a Replacement for Mindjet ...
- SWOT analysis for a small independent bookstore | Cross ...
- ERD | Entity Relationship Diagrams, ERD Software for Mac and Win
- Flowchart | Basic Flowchart Symbols and Meaning
- Flowchart | Flowchart Design - Symbols, Shapes, Stencils and Icons
- Flowchart | Flow Chart Symbols
- Electrical | Electrical Drawing - Wiring and Circuits Schematics
- Flowchart | Common Flowchart Symbols
- Flowchart | Common Flowchart Symbols