Swim Lane Diagrams

3 Circle Venn Diagram. Venn Diagram Example

Venn Diagrams visualize all possible logical intersections between several sets and are widely used in mathematics, logic, statistics, marketing, sociology, etc.
Swim Lane Flowchart Symbols

How to Draw Business Process Diagrams with RapidDraw Interface

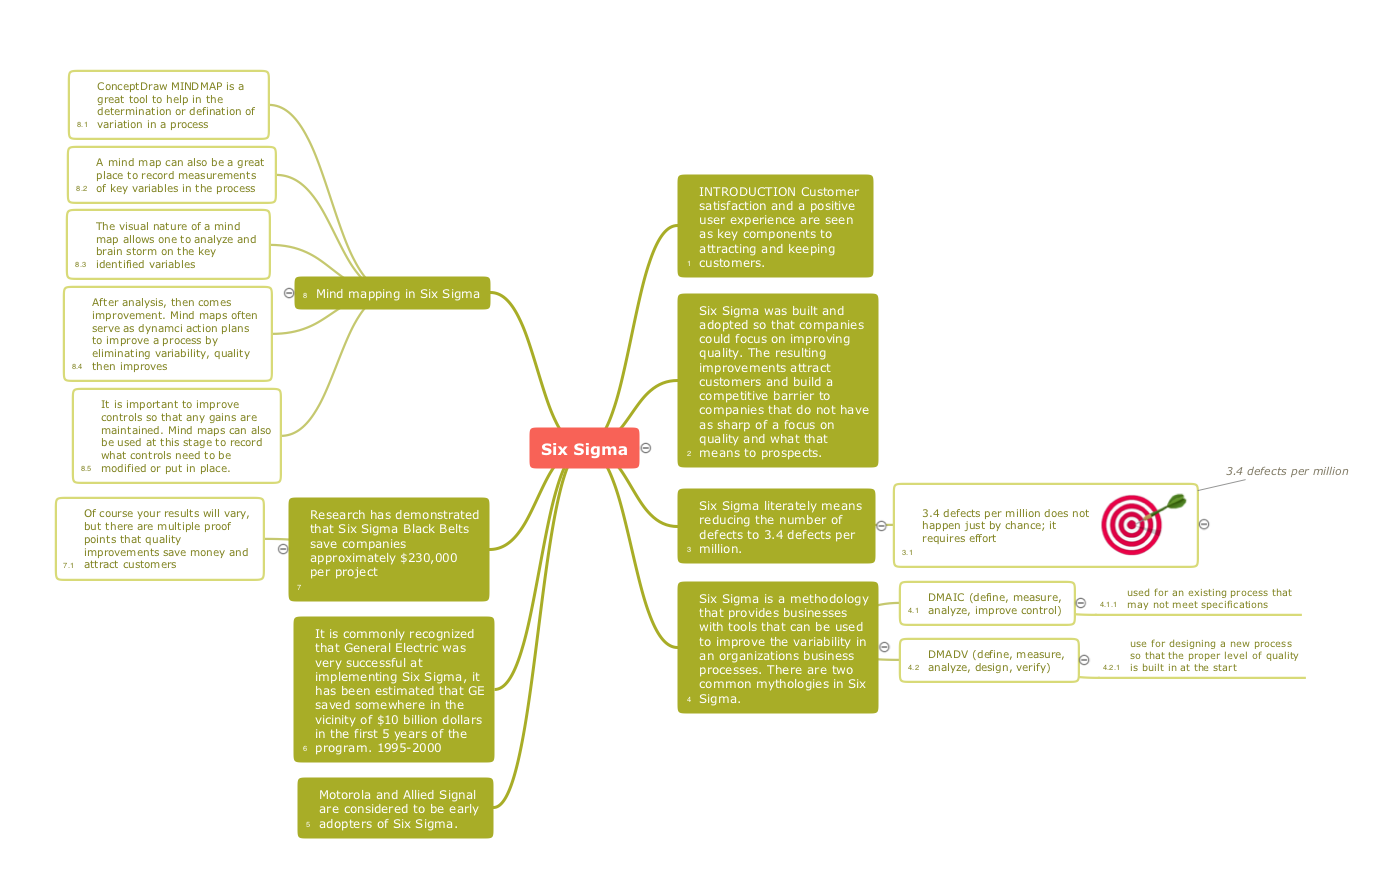
Quality Improvement
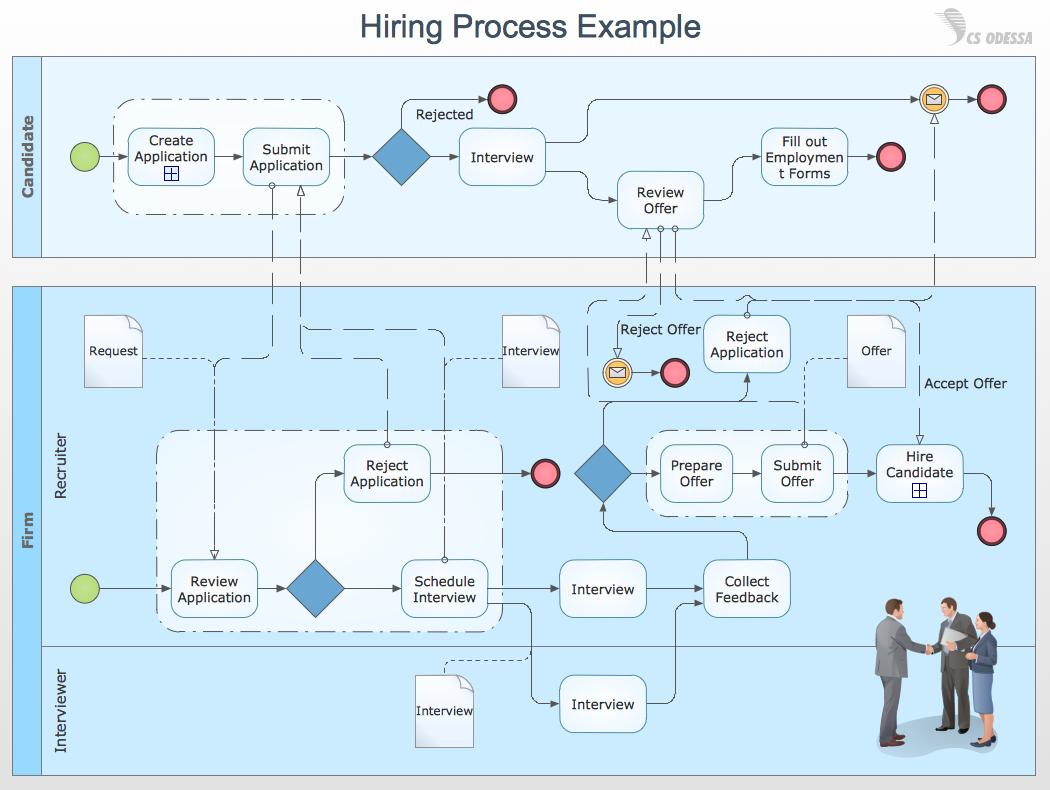
 Cross-Functional Flowcharts
Cross-functional flowcharts are powerful and useful tool for visualizing and analyzing complex business processes which requires involvement of multiple people, teams or even departments. They let clearly represent a sequence of the process steps, the order of operations, relationships between processes and responsible functional units (such as departments or positions).
Workflow Diagram

The workflow represents the transferring of data, documents or tasks during a work process. To make it easier to study and analyze working processes, and to present them in a simple visual manner, workflow diagrams are used. To create these diagrams professional use workflow diagram maker software ConceptDraw DIAGRAM.
Swim Lanes Flowchart. Flowchart Examples

This sample shows the Swim Lanes Flowchart of Identification and logging.

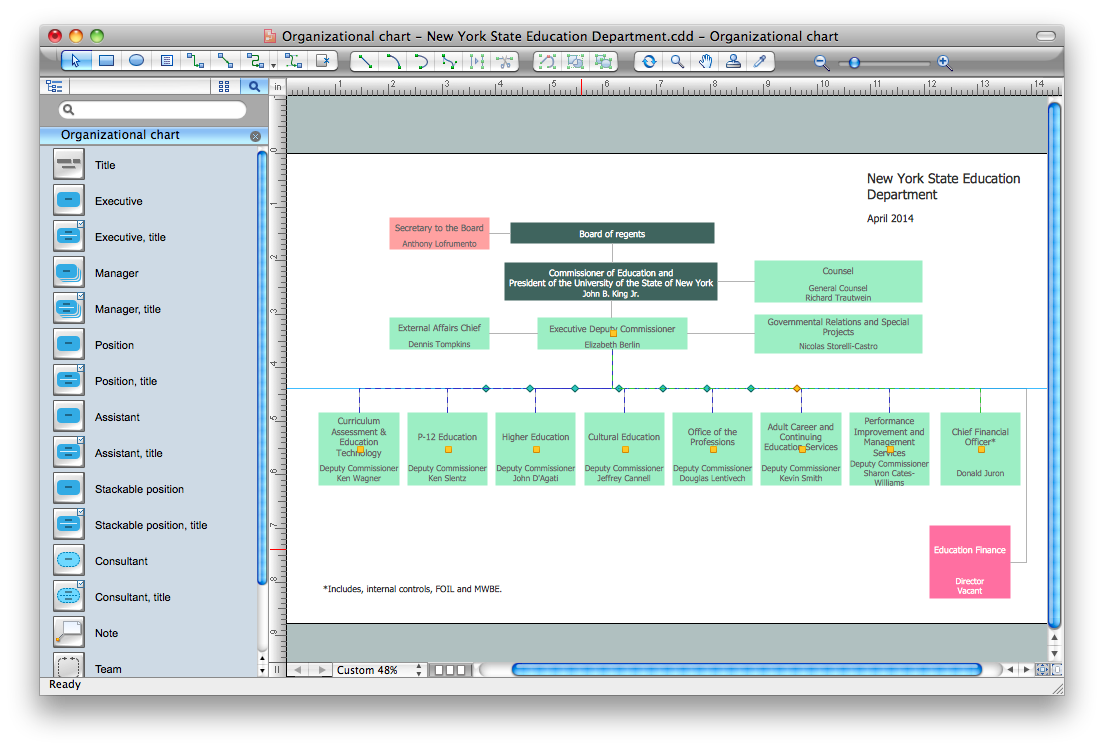
Organization Chart Software

Business Process Modeling with ConceptDraw
The Best Business Process Modeling Software
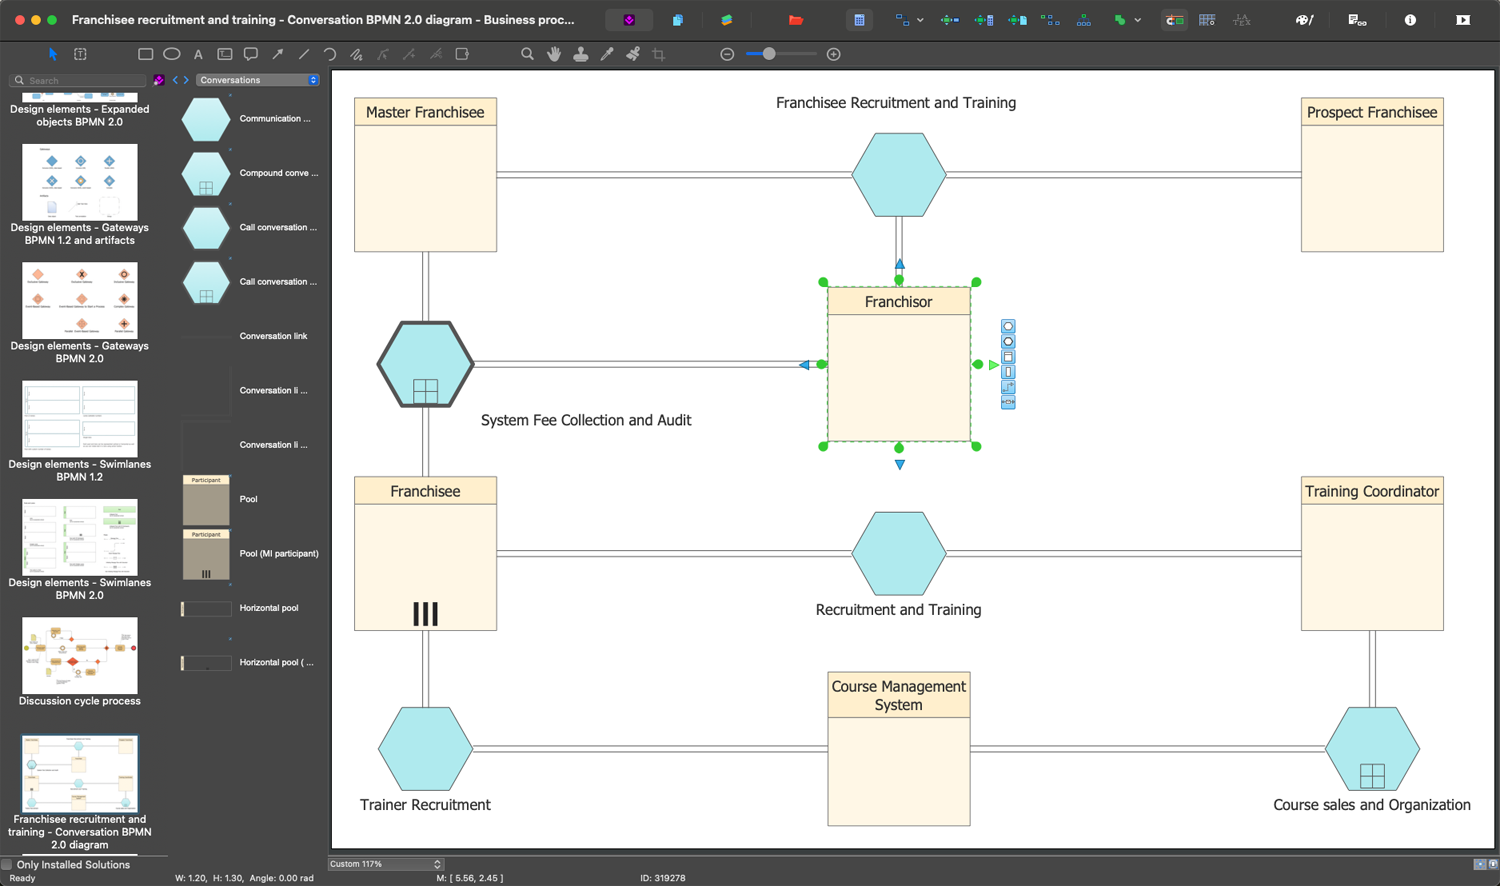
ConceptDraw has 142 vector stencils in the 8 libraries that helps you to start using Diagramming Software for designing own Business Process Diagrams.

Data Flow Diagram Model

How to Use the ″Online Store PR Campaign″ Sample

ConceptDraw Arrows10 Technology

- points;
- Connecting groups of objects;
- Auto-routing;
- Connectors text;
- Snap to Guides ;
- Quick.
- Swim Lane Diagram Ppt
- Presenting Documents with Skype | Business People Figures ...
- Business Process Elements: Swimlanes
- Swim Lane Ppt
- Business Process Elements
- Swimlanes Ppt
- Basic Flowchart Symbols and Meaning | Flowchart design ...
- Network Topologies | Project Management Area | Swim Lane ...
- Flow Chart for Olympic Sports | Mac Compatible Remote ...
- Swimlane Diagram Erd
- Cross-Functional Flowcharts | Swim Lane Diagrams | Cross ...
- Swim Lane Diagrams | Mac OS X User Interface | Graphic User ...
- Business Processes | How To Make a PowerPoint Presentation of a ...
- Swim Lane Diagrams | Affinity Diagram | Swim Lane Flowchart ...
- Payroll process - Swim lane process mapping diagram | Design ...
- Presenting Documents with Skype | How to Perform a Dynamic ...
- Business Process Elements: Swimlanes
- Presenting Documents with Skype
- Swim Lane Diagrams | Swim Lane Flowchart Symbols | Cross ...
- Online Diagram Tool | Swim Lane Diagrams | ConceptDraw Solution ...
- ERD | Entity Relationship Diagrams, ERD Software for Mac and Win
- Flowchart | Basic Flowchart Symbols and Meaning
- Flowchart | Flowchart Design - Symbols, Shapes, Stencils and Icons
- Flowchart | Flow Chart Symbols
- Electrical | Electrical Drawing - Wiring and Circuits Schematics
- Flowchart | Common Flowchart Symbols
- Flowchart | Common Flowchart Symbols