Venn Diagram Examples for Problem Solving. Environmental Social Science. Human Sustainability Confluence

Create your Venn diagrams for problem solving in environmental social science using the ConceptDraw DIAGRAM diagramming and vector drawing software extended with the Venn Diagrams solution from the area "Diagrams" of ConceptDraw Solution Park.
This Venn diagram sample depicts the path to sustainable development.
"Sustainable development is an organizing principle for human life on a finite planet. It posits a desirable future state for human societies in which living conditions and resource-use meet human needs without undermining the sustainability of natural systems and the environment, so that future generations may also have their needs met.
Sustainable development ties together concern for the carrying capacity of natural systems with the social and economic challenges faced by humanity. As early as the 1970s, 'sustainability' was employed to describe an economy "in equilibrium with basic ecological support systems." Scientists in many fields have highlighted The Limits to Growth, and economists have presented alternatives, for example a 'steady state economy', to address concerns over the impacts of expanding human development on the planet." [Sustainable development. Wikipedia]
The Venn diagram example "Path to sustainable development" was created using the ConceptDraw PRO diagramming and vector drawing software extended with the Venn Diagrams solution from the area "What is a Diagram" of ConceptDraw Solution Park.
Venn diagram

Using Fishbone Diagrams for Problem Solving

Using Fishbone Diagrams for Problem Solving is a productive and illustrative tool to identify the most important factors causing the trouble. ConceptDraw DIAGRAM extended with Fishbone Diagrams solution from the Management area of ConceptDraw Solution Park is a powerful tool for problem solving with Fishbone Ishikawa diagram graphic method.
Basic Circles Venn Diagram. Venn Diagram Example

This Venn Diagram shows the relative complement of the set A with respect to the set B. It is the set of the elements in B, but not in A. In other words it is the set-theoretic difference B-A.
3 Circle Venn. Venn Diagram Example

Garrett IA Diagrams with ConceptDraw DIAGRAM

SWOT Analysis

Simple Drawing Applications for Mac

Bar Diagram Math

Basic Audit Flowchart. Flowchart Examples

The Audit Flowcharts are widely used in the financial management, accounting, money management and in many others fields.
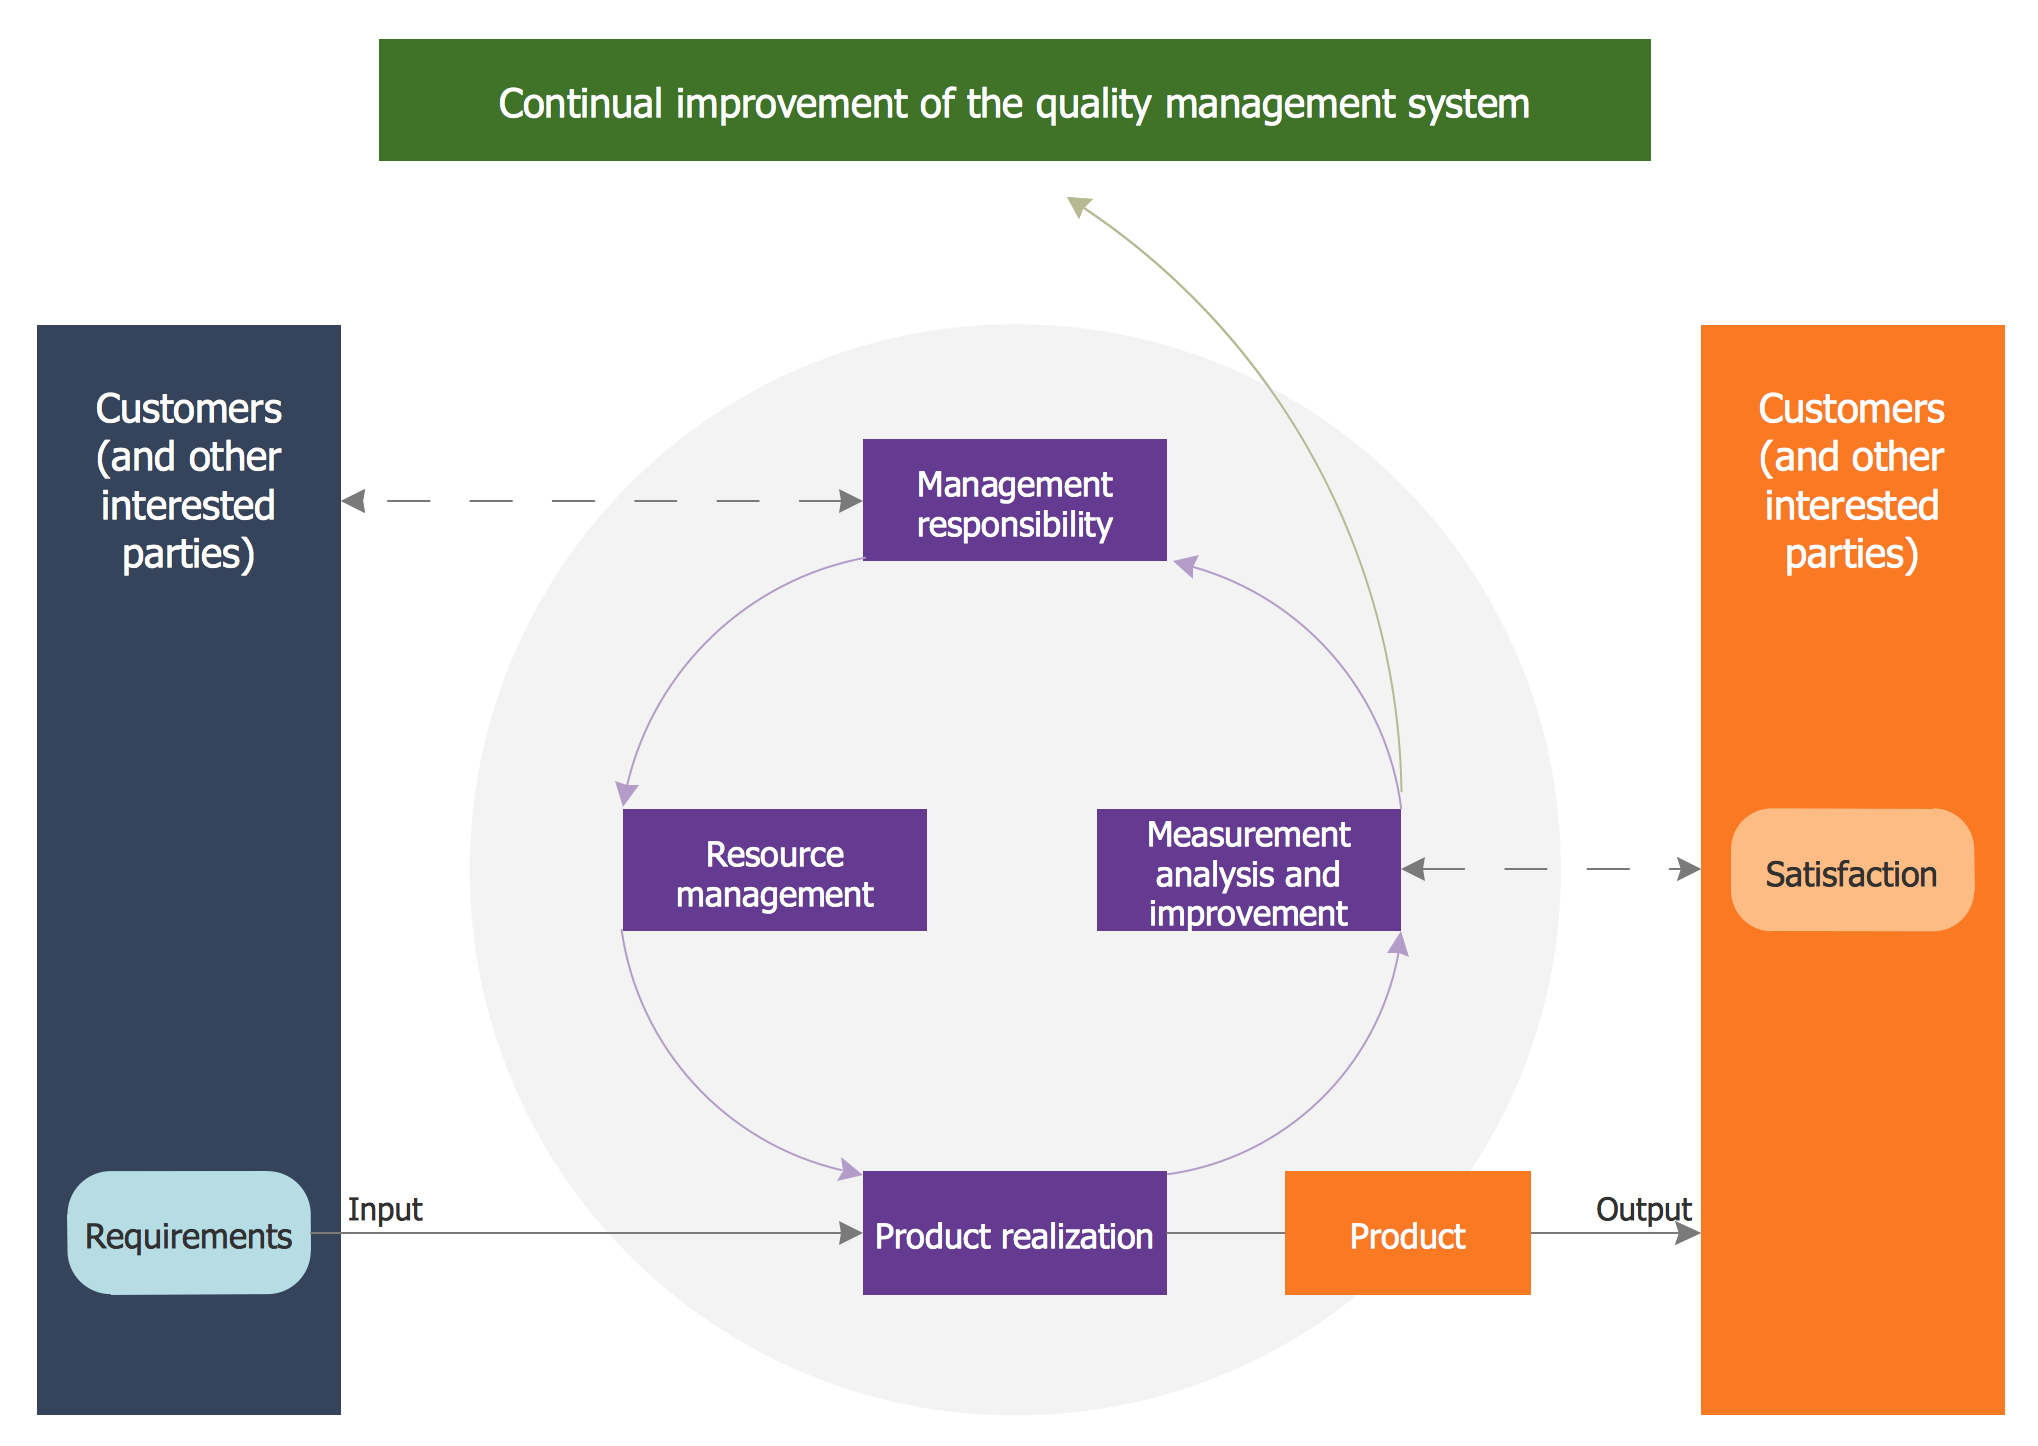
Quality Management System
HR Flowchart Symbols

Material Requisition Flowchart. Flowchart Examples

The flowchart example shows the material requisition business process.
This circle-spoke diagram sample shows how leadership and data provide essential coordination of other functions in an asset management environment. Leadership points the way and common data systems keep all divisions communicating effectively.
This circle-spoke diagram example was created on the base of illustration of article "Beyond the Short Term: Transportation Asset Management for Long-Term Sustainability, Accountability and Performance" from the website of The Federal Highway Administration (FHWA).
[fhwa.dot.gov/ asset/ 10009/ tam_ topr806_ 3.cfm]
"Asset management, broadly defined, refers to any system that monitors and maintains things of value to an entity or group. It may apply to both tangible assets such as buildings and to intangible concepts such as intellectual property and goodwill. Asset management is a systematic process of operating, maintaining, upgrading, and disposing of assets cost-effectively. Alternative views of asset management in the engineering environment are: the practice of managing assets to achieve the greatest return (particularly useful for productive assets such as plant and equipment), and the process of monitoring and maintaining facilities systems, with the objective of providing the best possible service to users (appropriate for public infrastructure assets)." [Asset management. Wikipedia]
The hub-and-spoke diagram example "Leadership and data" was created using the ConceptDraw PRO diagramming and vector drawing software extended with the Circle-Spoke Diagrams solution from the area "What is a Diagram" of ConceptDraw Solution Park.
Circle-spoke diagram

Venn Diagram

- Sustainability Venn Diagram
- Venn Diagram Examples for Problem Solving. Environmental Social ...
- Path to sustainable development | Venn Diagram Examples for ...
- Path to sustainable development | Sustainable development | Venn ...
- Path to sustainable development | Circle-Spoke Diagrams | Concept ...
- Diagrams Of Sustainability Of The Environment
- Sustainable Use Of Resources Diagrams
- Sustainability Venn Diagram Explained
- Sustainability Bubble Diagram Social Economy Environment
- Fishbone Diagram For Sustainability
- Path to sustainable development | Human Resource Development ...
- Venn Diagrams | Fishbone Diagram Sustainability
- Venn diagram - Path to sustainable development | Sustainable ...
- Path to sustainable development | Histograms | Principle Of Human ...
- Sustainable Development Flow Chart
- Path to sustainable development | Venn Diagrams | Basic Circles ...
- Sustainable development | Path to sustainable development ...
- Entity Relationship Diagram Software Engineering | Process ...
- Path to sustainable development | SWOT Analysis | SWOT Analysis ...
- Fundraising Pyramid | Venn Diagrams | Pyramid Diagram ...
- ERD | Entity Relationship Diagrams, ERD Software for Mac and Win
- Flowchart | Basic Flowchart Symbols and Meaning
- Flowchart | Flowchart Design - Symbols, Shapes, Stencils and Icons
- Flowchart | Flow Chart Symbols
- Electrical | Electrical Drawing - Wiring and Circuits Schematics
- Flowchart | Common Flowchart Symbols
- Flowchart | Common Flowchart Symbols