"In mathematics, the sine function is a trigonometric function of an angle. The sine of an angle is defined in the context of a right triangle: for the specified angle, it is the ratio of the length of the side that is opposite that angle to (divided by) the length of the longest side of the triangle (i.e. the hypotenuse).
Trigonometric functions are commonly defined as ratios of two sides of a right triangle containing the angle, and can equivalently be defined as the lengths of various line segments from a unit circle. More modern definitions express them as infinite series or as solutions of certain differential equations, allowing their extension to arbitrary positive and negative values and even to complex numbers.
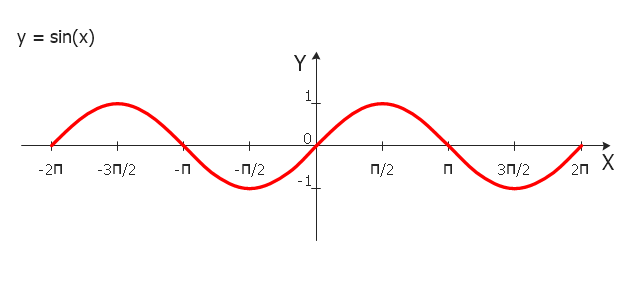
The sine function is commonly used to model periodic phenomena such as sound and light waves, the position and velocity of harmonic oscillators, sunlight intensity and day length, and average temperature variations throughout the year." [Sine. Wikipedia]
The trigonometric function graph example "Sine function" was created using the ConceptDraw PRO diagramming and vector drawing software extended with the Mathematics solution from the Science and Education area of ConceptDraw Solution Park.
www.conceptdraw.com/ solution-park/ science-education-mathematics
Trigonometric functions are commonly defined as ratios of two sides of a right triangle containing the angle, and can equivalently be defined as the lengths of various line segments from a unit circle. More modern definitions express them as infinite series or as solutions of certain differential equations, allowing their extension to arbitrary positive and negative values and even to complex numbers.
The sine function is commonly used to model periodic phenomena such as sound and light waves, the position and velocity of harmonic oscillators, sunlight intensity and day length, and average temperature variations throughout the year." [Sine. Wikipedia]
The trigonometric function graph example "Sine function" was created using the ConceptDraw PRO diagramming and vector drawing software extended with the Mathematics solution from the Science and Education area of ConceptDraw Solution Park.
www.conceptdraw.com/ solution-park/ science-education-mathematics
Sine function graph
The vector stencils library "Weather" contains 17 weather clipart images for drawing illustrations on climate to show cloudiness, air temperature, precipitation, wind.
"Weather is the state of the atmosphere, to the degree that it is hot or cold, wet or dry, calm or stormy, clear or cloudy. Most weather phenomena occur in the troposphere, just below the stratosphere. Weather generally refers to day-to-day temperature and precipitation activity, whereas climate is the term for the average atmospheric conditions over longer periods of time. When used without qualification, "weather", is generally understood to mean the weather of Earth.
Weather is driven by air pressure (temperature and moisture) differences between one place and another. These pressure and temperature differences can occur due to the sun angle at any particular spot, which varies by latitude from the tropics. The strong temperature contrast between polar and tropical air gives rise to the jet stream. Weather systems in the mid-latitudes, such as extratropical cyclones, are caused by instabilities of the jet stream flow. Because the Earth's axis is tilted relative to its orbital plane, sunlight is incident at different angles at different times of the year. On Earth's surface, temperatures usually range ±40°C (−40°F to 100°F) annually. Over thousands of years, changes in Earth's orbit affect the amount and distribution of solar energy received by the Earth and influence long-term climate and global climate change." [Weather. Wikipedia]
The clip art example "Weather - Vector stencils library" was created using the ConceptDraw PRO diagramming and vector drawing software extended with the Nature solution from the Illustration area of ConceptDraw Solution Park.
www.conceptdraw.com/ solution-park/ illustrations-nature
Sunny

Cloudy

Overcast

Snow

Rain

Lightning

Hot

Warm

Frost

Mist

Strong wind

Flood

Tsunami

Dew

Hoar-frost

Earthquake

Snowflake

- Sine function | Weather - Vector stencils library | Sunlight
- Weather - Vector stencils library
- How can you illustrate the weather condition | Illustration | Weather ...
- Weather - Vector stencils library | Flowchart - Food security ...
- Quality function deployment chart - Handheld projector | Sine ...
- New Year card template - Snowflakes and Ribbon
- How To Create Presentation for Trainings and Learning process ...
- Resources and energy - Vector stencils library
- Pie Chart Examples and Templates - Conceptdraw.com
- Workflow diagram - Weather forecast | How can you illustrate the ...
- Resources and energy - Vector stencils library | Energy resources ...
- Rail transport - Vector stencils library | Aircraft - Vector stencils ...
- Nature | Drawing a Nature Scene | Beauty in nature Illustrations and ...
- ERD | Entity Relationship Diagrams, ERD Software for Mac and Win
- Flowchart | Basic Flowchart Symbols and Meaning
- Flowchart | Flowchart Design - Symbols, Shapes, Stencils and Icons
- Flowchart | Flow Chart Symbols
- Electrical | Electrical Drawing - Wiring and Circuits Schematics
- Flowchart | Common Flowchart Symbols
- Flowchart | Common Flowchart Symbols