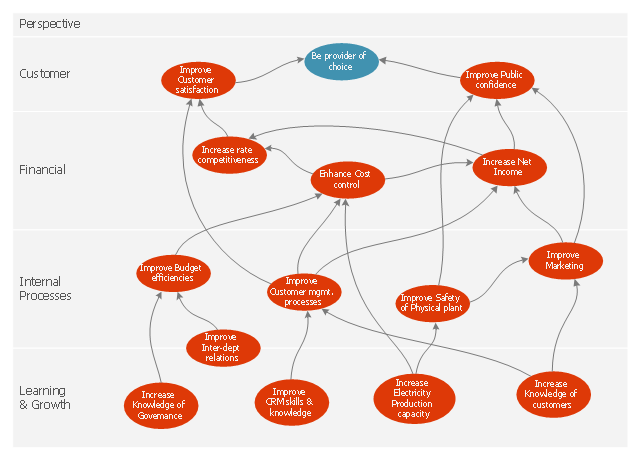
This marketing diagram sample depicts balanced scorecard strategy map.
It was redesigned from the Wikimedia Commons file: Strategy map.JPG. [commons.wikimedia.org/ wiki/ File:Strategy_ map.JPG]
"A strategy map is a diagram that is used to document the primary strategic goals being pursued by an organization or management team. It is an element of the documentation associated with the Balanced Scorecard...
Strategy maps show:
(1) Each objective as text appearing within a shape (usually an oval or rectangle).
(2) Relatively few objectives (usually less than 20).
(3) Objectives are arrayed across two or more horizontal bands on the strategy map, with each band representing a 'perspective'.
(4) Broad causal relationships between objectives shown with arrows that either join objectives together, or placed in a way not linked with specific objectives but to provide general euphemistic indications of where causality lies." [Strategy map. Wikipedia]
The marketing diagram example "Balanced scorecard strategy map" was created using the ConceptDraw PRO diagramming and vector drawing software extended with the Marketing Diagrams solution from the Marketing area of ConceptDraw Solution Park.
Marketing diagram
Remote Projects in Corporate Strategy


 Marketing
This solution extends ConceptDraw DIAGRAM and ConceptDraw MINDMAP with Marketing Diagrams and Mind Maps (brainstorming, preparing and holding meetings and presentations, sales calls).
 Management
This solution extends ConceptDraw DIAGRAM and ConceptDraw MINDMAP with Management Diagrams and Mind Maps (decision making, scheduling, thinking ideas, problem solving, business planning, company organizing, SWOT analysis, preparing and holding meetings
 MindWave for SAP Streamworks
ConceptDraw MindWave for SAP StreamWork allows you to visualize the process of collaboration, increase effectiveness of team work, prepare supporting presentations and achieve ready-to-use documents.
SWOT Analysis Solution - Strategy Tools

Mind Maps for Business - SWOT Analysis

Market Chart
How to show a mind map presentation via Skype
Business Tools Perceptual Mapping

Perception Mapping helps organizations measure and transform all aspects of their business, people and culture. Perception Mapping allows to represent the complex relationships graphically, helps identify potential problems of the organization and make the best decisions.
How to Connect Social Media DFD Flowchart with Action Maps

 Marketing Diagrams
Marketing Diagrams solution extends ConceptDraw DIAGRAM diagramming software with abundance of samples, templates and vector design elements intended for easy graphical visualization and drawing different types of Marketing diagrams and graphs, including Branding Strategies Diagram, Five Forces Model Diagram, Decision Tree Diagram, Puzzle Diagram, Step Diagram, Process Chart, Strategy Map, Funnel Diagram, Value Chain Diagram, Ladder of Customer Loyalty Diagram, Leaky Bucket Diagram, Promotional Mix Diagram, Service-Goods Continuum Diagram, Six Markets Model Diagram, Sources of Customer Satisfaction Diagram, etc. Analyze effectively the marketing activity of your company and apply the optimal marketing methods with ConceptDraw DIAGRAM software.
HelpDesk
How to Make SWOT Analysis in a Word Document

 Business Processes
Business Process solution extends ConceptDraw DIAGRAM software with business process diagrams as cross-functional flowcharts, workflows, process charts, IDEF0, timelines, calendars, Gantt charts, business process modeling, audit and opportunity flowcharts.
- Strategy Map Free Software
- Balanced scorecard strategy map | Remote Projects in Corporate ...
- Marketing Map Strategy
- Balanced scorecard strategy map | Marketing Diagrams | Marketing ...
- Balanced scorecard strategy map | Design elements - Status ...
- Balanced Scorecard Software | Balanced scorecard strategy map ...
- Strategy Map Example
- Positioning Maps Strategy
- Strategy Map Template
- Build Strategies Exchanging Mind Maps with Evernote | Remote ...
- Business Strategy Diagram Maps
- Sales Strategy Diagram
- SWOT Analysis Solution - Strategy Tools | TOWS Matrix | TOWS ...
- Balanced scorecard strategy map
- Marketing | SWOT Analysis Solution - Strategy Tools | Sales Process ...
- Strategy Map Interne Externe
- Positioning map | SWOT Analysis Solution - Strategy Tools ...
- Map of Scotland | Map of UK — Scotland | Scottish Government ...
- Mind Maps for Business - SWOT Analysis | SWOT Analysis | SWOT ...
- | | Porter's Value Chain | Porters Strategic Matrix
- ERD | Entity Relationship Diagrams, ERD Software for Mac and Win
- Flowchart | Basic Flowchart Symbols and Meaning
- Flowchart | Flowchart Design - Symbols, Shapes, Stencils and Icons
- Flowchart | Flow Chart Symbols
- Electrical | Electrical Drawing - Wiring and Circuits Schematics
- Flowchart | Common Flowchart Symbols
- Flowchart | Common Flowchart Symbols