Pyramid Chart Examples

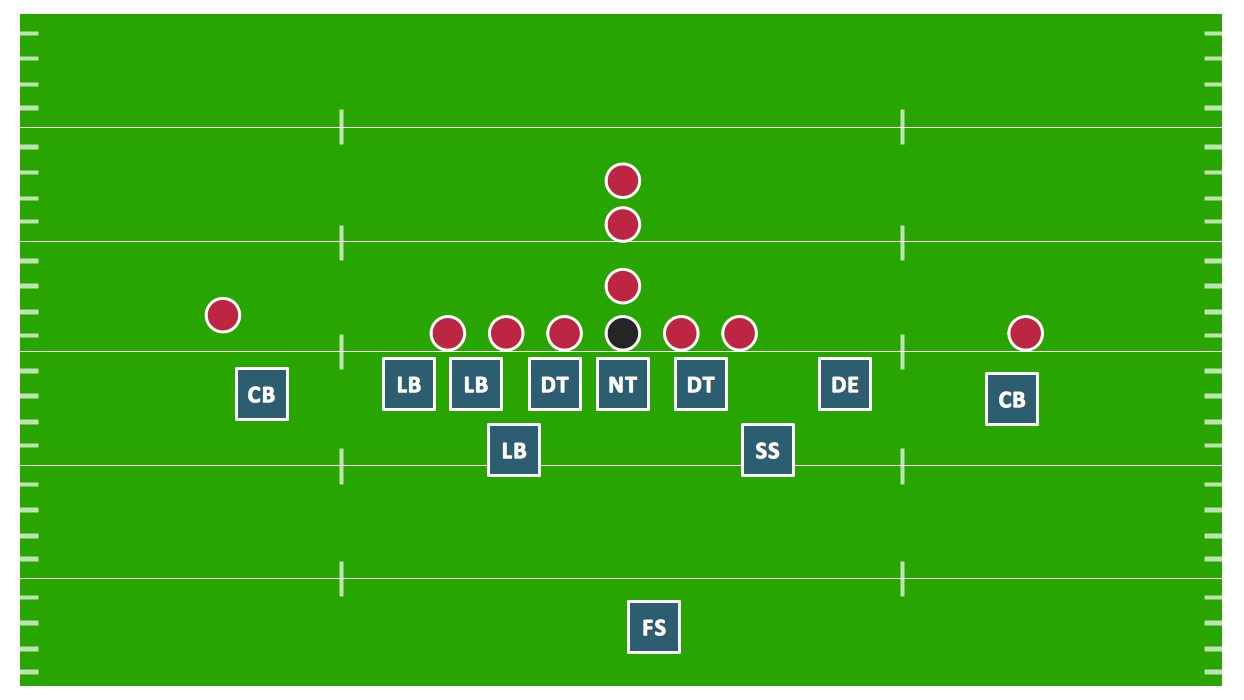
Defensive Strategy Diagram – 46 Defence
 ConceptDraw Solution Park
ConceptDraw Solution Park collects graphic extensions, examples and learning materials
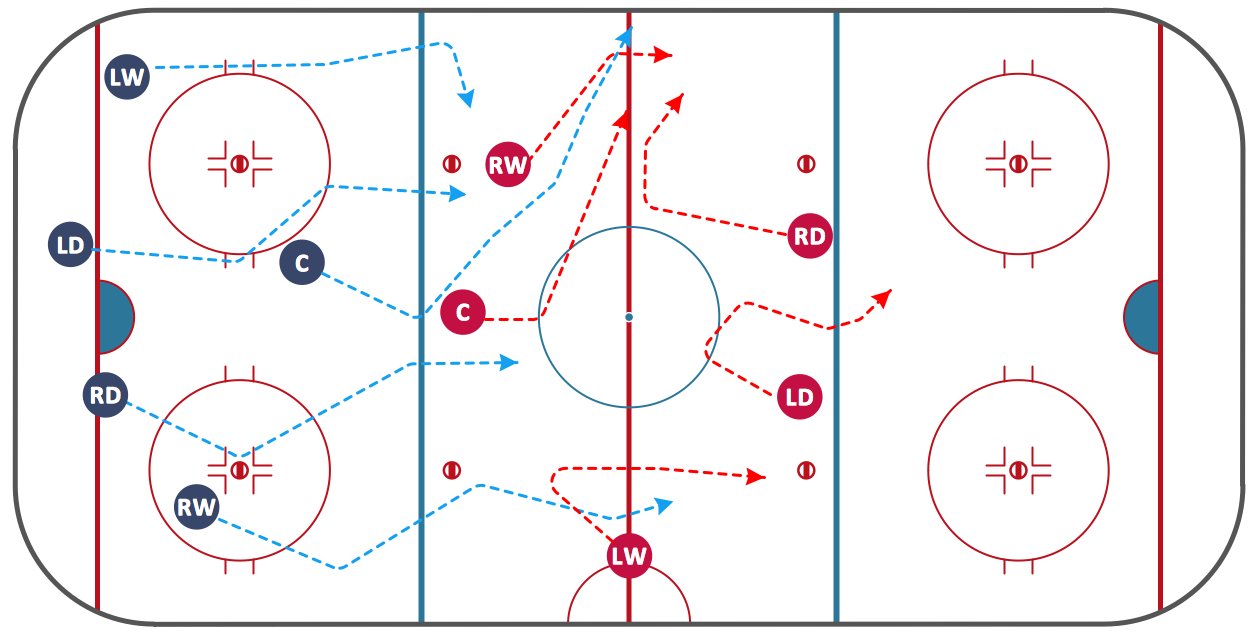
Ice Hockey Diagram — Defensive Strategy — Neutral Zone Trap
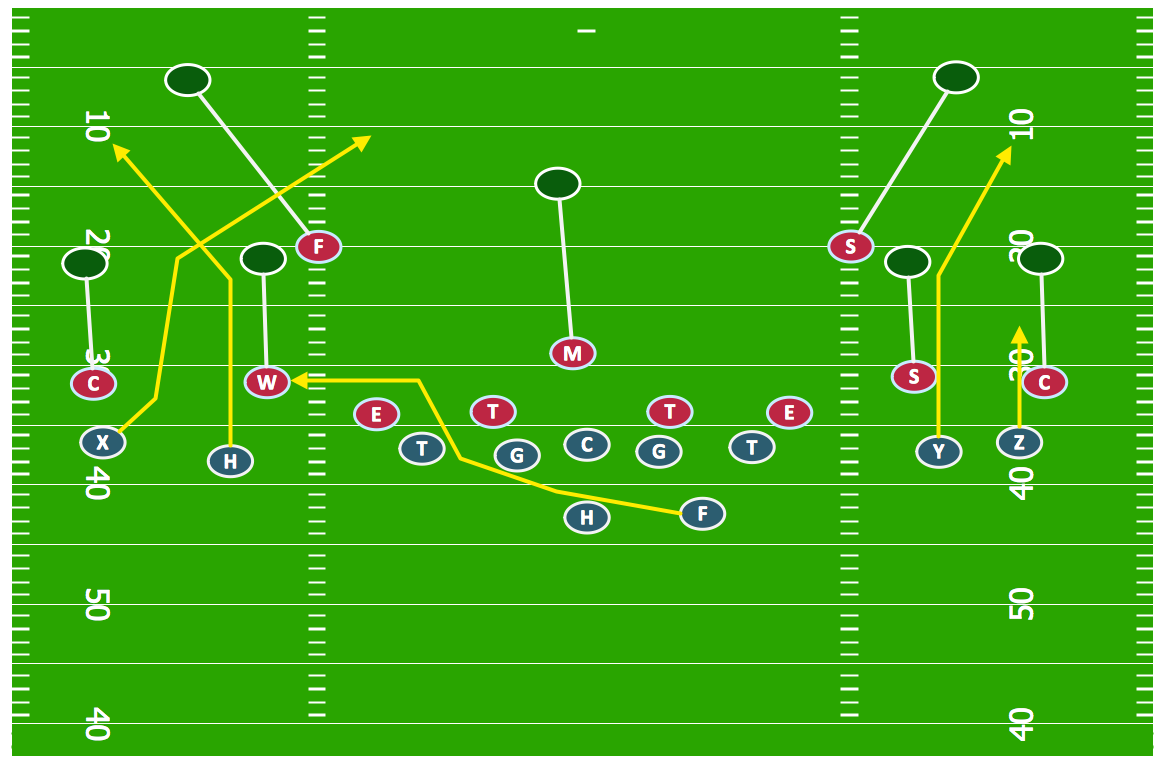
Offensive Strategy — Spread Offense Diagram
 Business Processes
Business Process solution extends ConceptDraw DIAGRAM software with business process diagrams as cross-functional flowcharts, workflows, process charts, IDEF0, timelines, calendars, Gantt charts, business process modeling, audit and opportunity flowcharts.
Business Diagram Software


Pyramid Diagram and Pyramid Chart

 Marketing Diagrams
Marketing Diagrams solution extends ConceptDraw DIAGRAM diagramming software with abundance of samples, templates and vector design elements intended for easy graphical visualization and drawing different types of Marketing diagrams and graphs, including Branding Strategies Diagram, Five Forces Model Diagram, Decision Tree Diagram, Puzzle Diagram, Step Diagram, Process Chart, Strategy Map, Funnel Diagram, Value Chain Diagram, Ladder of Customer Loyalty Diagram, Leaky Bucket Diagram, Promotional Mix Diagram, Service-Goods Continuum Diagram, Six Markets Model Diagram, Sources of Customer Satisfaction Diagram, etc. Analyze effectively the marketing activity of your company and apply the optimal marketing methods with ConceptDraw DIAGRAM software.
BPR Diagram. Business Process Reengineering Example

 Matrices
This solution extends ConceptDraw DIAGRAM software with samples, templates and library of design elements for drawing the business matrix diagrams.
 Pyramid Diagrams
Pyramid Diagrams solution extends ConceptDraw DIAGRAM software with templates, samples and library of vector stencils for drawing the marketing pyramid diagrams.
 Bubble Diagrams
Bubble diagrams have enjoyed great success in software engineering, architecture, economics, medicine, landscape design, scientific and educational process, for ideas organization during brainstorming, for making business illustrations, presentations, planning, design, and strategy development. They are popular because of their simplicity and their powerful visual communication attributes.
 Circle-Spoke Diagrams
Examples of subject areas that are well suited to this approach are marketing, business, products promotion, process modeling, market, resource, time, and cost analysis. Circle-Spoke Diagrams are successfully used in presentations, conferences, management documents, magazines, reportages, reviews, reports, TV, and social media.
 Football
The Football Solution extends ConceptDraw DIAGRAM software with samples, templates, and libraries of vector objects for drawing football (American) diagrams, plays schemas, and illustrations. It can be used to make professional looking documen
Cross Functional Flowchart Examples

Try now Flowchart Software and Cross-Functional library with 2 libraries and 45 vector shapes of the Cross-Functional Flowcharts solution. Then you can use built-in templates to create and present your software service cross-function process flowcharts.
Total Quality Management Business Diagram

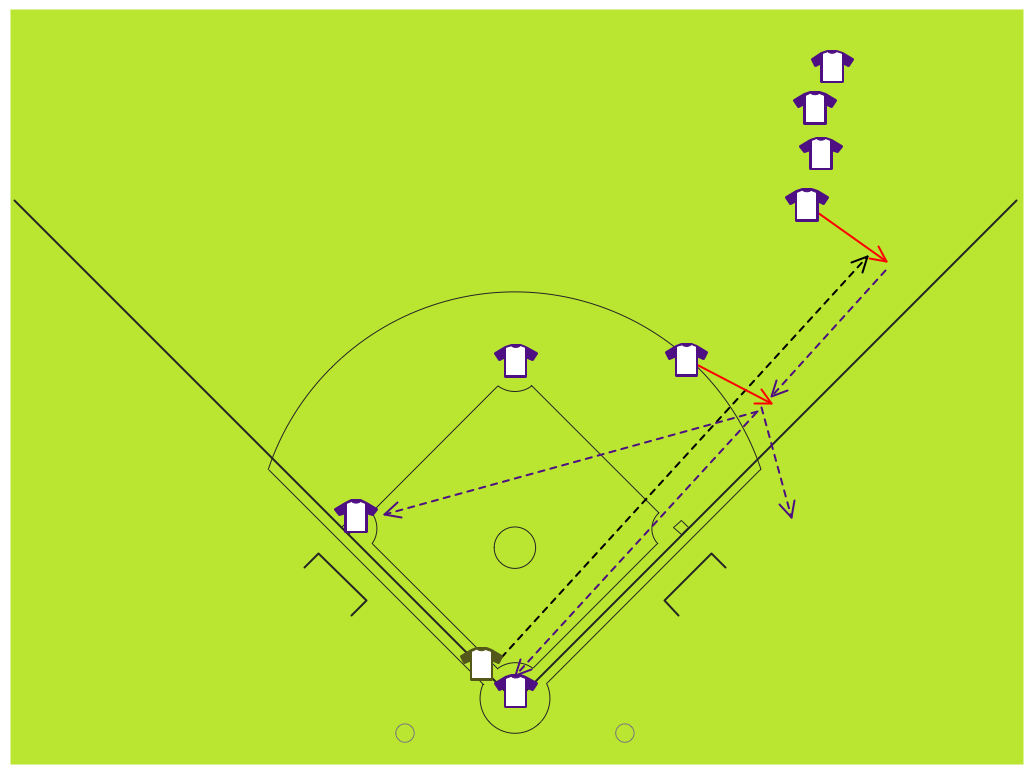
Baseball Diagram – Fielding Drill – Hit the Cutoff
 MindWave for SAP Streamworks
ConceptDraw MindWave for SAP StreamWork allows you to visualize the process of collaboration, increase effectiveness of team work, prepare supporting presentations and achieve ready-to-use documents.
- SWOT analysis matrix diagram examples | SWOT Analysis Solution ...
- Pyramid Chart Examples | Diagram Software - The Best Choice for ...
- Value pyramid - Marketing diagram | Pyramid Diagrams | Social ...
- Social strategy pyramid - Marketing diagram | Pyramid Chart ...
- Pyramid Chart Examples | Top brand model pyramid diagram ...
- Social strategy pyramid - Marketing diagram | SWOT Analysis ...
- SWOT Analysis Solution - Strategy Tools | Swot Analysis Examples ...
- Remote Projects in Corporate Strategy | Pyramid Chart Examples ...
- Marketing | SWOT Analysis Solution - Strategy Tools | Pyramid Chart ...
- Pyramid Chart Examples | SWOT Analysis Solution - Strategy Tools ...
- Social strategy pyramid - Marketing diagram | Four-quadrant matrix ...
- Social strategy - Pyramid diagram | Pyramid Chart Examples | SWOT ...
- TOWS analysis matrix diagram - Template | SWOT Analysis Solution ...
- Social strategy pyramid - Marketing diagram | Marketing Diagrams ...
- Porter's generic strategies matrix diagram | SWOT Analysis Solution ...
- Social strategy - Pyramid diagram | Pyramid Chart Examples | How ...
- Defensive Strategy Diagram 46 Defence | SWOT Analysis Solution ...
- Porter's generic strategies matrix diagram | Competitive strategy ...
- SWOT Analysis Solution - Strategy Tools | Pyramid Chart Examples ...
- Marketing Analysis Diagram | Social strategy pyramid - Marketing ...
- ERD | Entity Relationship Diagrams, ERD Software for Mac and Win
- Flowchart | Basic Flowchart Symbols and Meaning
- Flowchart | Flowchart Design - Symbols, Shapes, Stencils and Icons
- Flowchart | Flow Chart Symbols
- Electrical | Electrical Drawing - Wiring and Circuits Schematics
- Flowchart | Common Flowchart Symbols
- Flowchart | Common Flowchart Symbols