The cycle diagram sample was created on the base of the figure illustrating the webpage "2. POLICY & STRATEGY" of "Scottish Police College Primary Inspection 2006: A Report by Her Majesty's Inspectorate of Constabulary" from the Scottish Government website.
"Strategic Planning.
2.1 The planning process for the College currently follows a structured approach, starting in April and extending through the financial year. The planning cycle is illustrated in figure 2. ...
2.2 The College recognises the need to consult with its customers and stakeholders in the process of setting objectives and directing the training programme. The planning cycle to date refers to force visits, environmental scanning, the course planning process which involves consultation with all forces and other common police services, as well as to a survey of external providers.
2.3 The information from consultation feeds into an EFQM framework from which the College has identified four key policies, namely:
(1) developing and delivering quality training;
(2) developing our people through lifelong learning;
(3) continuous improvement of our service; and
(4) embracing the changing environment.
2.4 The objectives set at divisional level are designed to contribute to delivering these policies. HMIC found that whilst the selected objectives were presented in line with the structure, not all could be considered to meet SMART (Specific, Measurable, Achievable, Relevant and Timed) criteria. This failure indicates that while the process appears suitably structured to deliver a robust result, some of those involved could perhaps have a better understanding of the process." [scotland.gov.uk/ Publications/ 2007/ 02/ 15134652/ 8]
The cycle diagram example "Strategic planning" was created using the ConceptDraw PRO diagramming and vector drawing software extended with the Target and Circular Diagrams solution from the Marketing area of ConceptDraw Solution Park.
www.conceptdraw.com/ solution-park/ marketing-target-and-circular-diagrams
Cycle diagram

This arrow loop diagram sample was created on the base of the figure illustrating the webpage "Safe Roads for a Safer Future A Joint Safety Strategic Plan" from the website of US Department of Transportation - Federal Highway Administration (FHWA) Office of Safety.
"STRATEGIC PLANNING CYCLE.
After the safety units issue the SSP, they will identify and prioritize strategies to support the established goals. Many strategies will originate in existing roadmaps or in other program planning activities. The safety units will also use this information when developing their Unit Performance Plans and individual performance plans. Teams within each safety unit will carry out projects and activities to support identified strategies and achieve the SSP goals.
The SSP process also includes continuous performance monitoring and evaluation through which the safety units will review past accomplishments against the established goals, consider how well strategies are implemented, assess progress toward goals, identify risks, consider changes in the environment, and discuss future strategic direction. As a part of the evaluation process, the three safety units will recognize achievements and discuss the need for adjustments. Figure ... shows the strategic planning cycle.
The safety units will update the SSP every 3 to 5 years using input from a variety of sources, including evaluations, safety trends, and legislative changes." [safety.fhwa.dot.gov/ ssp/ ]
The arrow loop diagram example "Strategic planning cycle" was created using the ConceptDraw PRO diagramming and vector drawing software extended with the Target and Circular Diagrams solution from the Marketing area of ConceptDraw Solution Park.
www.conceptdraw.com/ solution-park/ marketing-target-and-circular-diagrams
Arrow loop diagram
Successful Strategic Plan

 Target and Circular Diagrams
This solution extends ConceptDraw PRO software with samples, templates and library of design elements for drawing the Target and Circular Diagrams.
Ansoff Matrix

Competitor Analysis

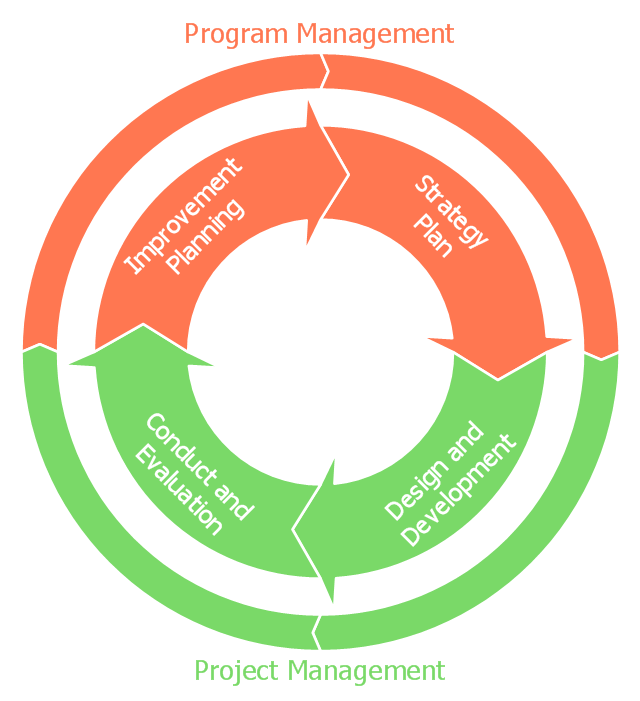
This circular arrows diagram sample shows the exercise cycle stages: 1) Strategy plan, 2) Design and development, 3) Conduct and evaluation, 4) Improvement planning. It was designed on the base of the diagram on the Emergency Management Insitute training IS-120.b webpage from the website of the Federal Emergency Management Agency (FEMA) of the United States Department of Homeland Security.
[emilms.fema.gov/ IS120A/ summary.htm]
"Exercises give communities, states, and regions a set of essential tools to prevent, prepare for, respond to, and recover from disasters." [emilms.fema.gov/ IS120A/ module0.htm]
"Disaster management (or emergency management) is the creation of plans through which communities reduce vulnerability to hazards and cope with disasters. Disaster management does not avert or eliminate the threats; instead, it focuses on creating plans to decrease the effect of disasters. Failure to create a plan could lead to human mortality, lost revenue, and damage to assets. Currently in the United States 60 percent of businesses do not have emergency management plans. Events covered by disaster management include acts of terrorism, industrial sabotage, fire, natural disasters (such as earthquakes, hurricanes, etc.), public disorder, industrial accidents, and communication failures." [Emergency management. Wikipedia]
The diagram example "Emergency management exercise cycle" was created using the ConceptDraw PRO diagramming and vector drawing software extended with the Basic Circular Arrows Diagrams solution from the area "What is a Diagram" of ConceptDraw Solution Park.
Circular arrows diagram
 Marketing Diagrams
Marketing Diagrams solution extends ConceptDraw PRO diagramming software with abundance of samples, templates and vector design elements intended for easy graphical visualization and drawing different types of Marketing diagrams and graphs, including Branding Strategies Diagram, Five Forces Model Diagram, Decision Tree Diagram, Puzzle Diagram, Step Diagram, Process Chart, Strategy Map, Funnel Diagram, Value Chain Diagram, Ladder of Customer Loyalty Diagram, Leaky Bucket Diagram, Promotional Mix Diagram, Service-Goods Continuum Diagram, Six Markets Model Diagram, Sources of Customer Satisfaction Diagram, etc. Analyze effectively the marketing activity of your company and apply the optimal marketing methods with ConceptDraw PRO software.
What is Gantt Chart (historical reference)

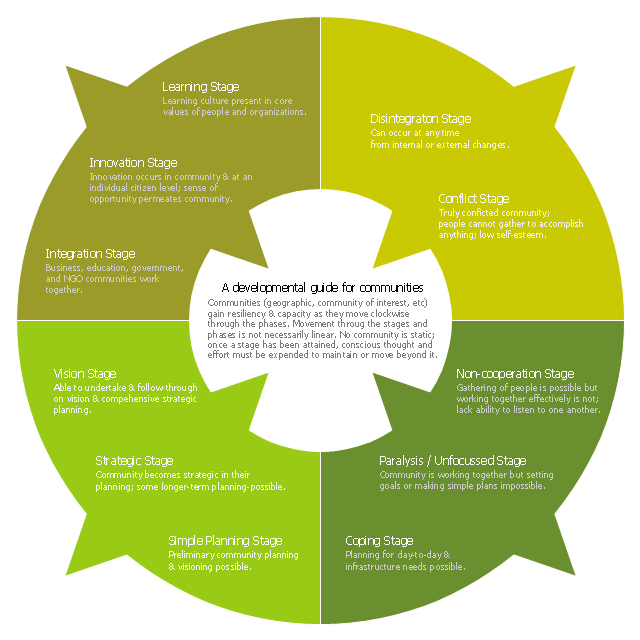
This ring chart sample was created on the base of the figure illustrating the "CCP Handbook - Comprehensive Community Planning for First Nations in British Columbia" from the Government of Canada website. "Tool 1: Centre for Innovative & Entrepreneurial Leadership (CIEL) Community Life Cycle Matrix.
Actualization Phase.
Community is highly developed and encourages learning & innovation while respecting history and culture. Community shares resources with others and regularly monitors itself, continuing to enhance capacity.
Action: Community undertakes regular reviews and reflection activities to maintain or enhance stage / phase.
Pre-Community or Chaos Phase.
Community is undeveloped. Limited sharing of resources or recognition of value of a community.
Action: Community can (re)form through the identification of and action of influential and respected leaders (elected or unelected).
Vision Phase.
Community recognizes the importance of vision and long-term planning; is able to move in this direction.
Action: Community can engage in planning, meaningful consultation of its members, & working towards the development of strategic thinking & planning, and, ultimately, identifying community-wide values, distinct community characteristics and a vision.
Emergence Phase.
Community exists but has significant problems, making anything but survival & fulfilling short-term needs impossible.
Action: Community can advance through focus on small, non-political, trustbuilding projects to build success, respect, confidence, relationships & skills.
Why the Matrix.
The challenge of developing innovative and entrepreneurial communities is in ensuring that the communities have a clear picture of where they are at and where they want to go. This enables a better match of the tools available with both the capacity of the community and the hoped for goal. For example, while strategic planning may work for some communities, the planning process may also lead to frustration and failure in other communities that do not have the necessary trust, social capital or capacity." [aadnc-aandc.gc.ca/ eng/ 1100100021972/ 1100100022090]
The ring chart example "Community life cycle matrix" was created using the ConceptDraw PRO diagramming and vector drawing software extended with the Target and Circular Diagrams solution from the Marketing area of ConceptDraw Solution Park.
www.conceptdraw.com/ solution-park/ marketing-target-and-circular-diagrams
Ring chart
- Strategic Planning Model Cycle
- Strategic planning cycle - Arrow loop diagram | Basic Flowchart ...
- Strategic planning - Cycle diagram | Successful Strategic Plan ...
- Strategic planning - Cycle diagram | Cross-Functional Process Map ...
- Successful Strategic Plan | Strategic planning cycle - Arrow loop ...
- Strategic planning - Cycle diagram
- Strategic Planning Defination With Block Diagram
- Strategic planning cycle - Arrow loop diagram
- Strategic planning - Cycle diagram | Strategic planning cycle - Arrow ...
- Successful Strategic Plan | Strategic planning - Cycle diagram ...
- ERD | Entity Relationship Diagrams, ERD Software for Mac and Win
- Flowchart | Basic Flowchart Symbols and Meaning
- Flowchart | Flowchart Design - Symbols, Shapes, Stencils and Icons
- Flowchart | Flow Chart Symbols
- Electrical | Electrical Drawing - Wiring and Circuits Schematics
- Flowchart | Common Flowchart Symbols
- Flowchart | Common Flowchart Symbols