"A patent ... is a set of exclusive rights granted by a sovereign state to an inventor or assignee for a limited period of time in exchange for detailed public disclosure of an invention. An invention is a solution to a specific technological problem and is a product or a process. Patents are a form of intellectual property.
The procedure for granting patents, requirements placed on the patentee, and the extent of the exclusive rights vary widely between countries according to national laws and international agreements. Typically, however, a granted patent application must include one or more claims that define the invention. A patent may include many claims, each of which defines a specific property right. These claims must meet relevant patentability requirements, such as novelty and non-obviousness. The exclusive right granted to a patentee in most countries is the right to prevent others from making, using, selling, importing, or distributing a patented invention without permission.
Under the World Trade Organization's (WTO) Agreement on Trade-Related Aspects of Intellectual Property Rights, patents should be available in WTO member states for any invention, in all fields of technology, and the term of protection available should be a minimum of twenty years. Nevertheless, there are variations on what is patentable subject matter from country to country." [Patent. Wikipedia]
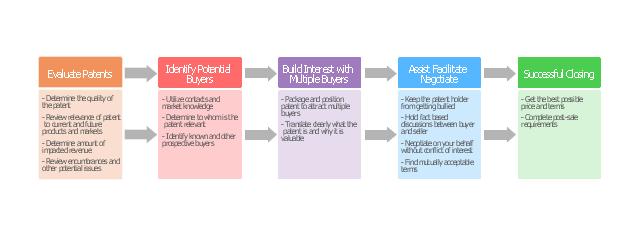
The step chart example "Selling technology patent process" was created using the ConceptDraw PRO diagramming and vector drawing software extended with the Block Diagrams solution from the area "What is a Diagram" of ConceptDraw Solution Park.
The procedure for granting patents, requirements placed on the patentee, and the extent of the exclusive rights vary widely between countries according to national laws and international agreements. Typically, however, a granted patent application must include one or more claims that define the invention. A patent may include many claims, each of which defines a specific property right. These claims must meet relevant patentability requirements, such as novelty and non-obviousness. The exclusive right granted to a patentee in most countries is the right to prevent others from making, using, selling, importing, or distributing a patented invention without permission.
Under the World Trade Organization's (WTO) Agreement on Trade-Related Aspects of Intellectual Property Rights, patents should be available in WTO member states for any invention, in all fields of technology, and the term of protection available should be a minimum of twenty years. Nevertheless, there are variations on what is patentable subject matter from country to country." [Patent. Wikipedia]
The step chart example "Selling technology patent process" was created using the ConceptDraw PRO diagramming and vector drawing software extended with the Block Diagrams solution from the area "What is a Diagram" of ConceptDraw Solution Park.
Step chart
Process Flowchart


Functional Flow Block Diagram

Basic Flowchart Symbols and Meaning


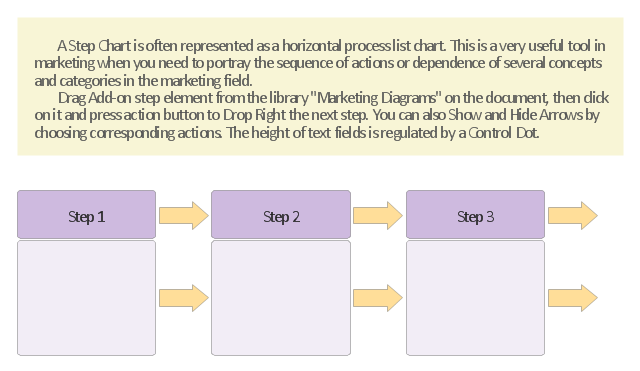
Step chart visualize a horizontal process list. It's used in marketing to portray the sequence of actions or dependence of several concepts and categories.
The step chart template for the ConceptDraw PRO diagramming and vector drawing software is included in the Block Diagrams solution from the area "What is a Diagram" of ConceptDraw Solution Park.
The step chart template for the ConceptDraw PRO diagramming and vector drawing software is included in the Block Diagrams solution from the area "What is a Diagram" of ConceptDraw Solution Park.
Step chart template
The vector stencils library "Marketing diagrams" contains 12 templates of marketing and sales diagrams and charts. Use it to illustrate your marketing and sales documents, presentations, infographics and webpages in ConceptDraw PRO software extended with Marketing Diagrams solution from Marketing area of ConceptDraw Solution Park.
Diffusion of Innovations

Normal distribution

Five forces model

Leaky bucket diagram

Funnel diagram

Relationship ladder of customer loyalty

Six markets model

Product life cycle graph

Extended product life cycle graph

Service-goods continuum diagram

Step chart block

Step diagram block

Basic Diagramming

Use Basic Diagramming solution to draw you own diagrams, charts and graphs for graphic communication, explanation of business and personal ideas and concepts, simple visual presentation of numerical data, complex structures, logical relations, step-by-step flows of actions or operations.

UML Block Diagram

This sample shows the work of the taxi service and is used by taxi stations, by airports, in the tourism field and delivery service.
The vector stencils library "Marketing diagrams" contains 12 templates of marketing and sales diagrams and charts. Use it to illustrate your marketing and sales documents, presentations, infographics and webpages in ConceptDraw PRO software extended with Marketing Diagrams solution from Marketing area of ConceptDraw Solution Park.
Diffusion of Innovations
Normal distribution
Five forces model
Leaky bucket diagram
Funnel diagram
Relationship ladder of customer loyalty
Six markets model
Product life cycle graph
Extended product life cycle graph
Service-goods continuum diagram
Step chart block
Step diagram block
HelpDesk
How to Add a Block Diagram to a PowerPoint Presentation

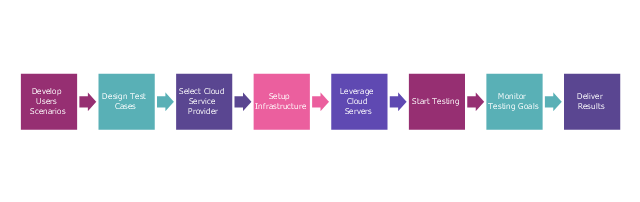
This step diagram example shows cloud testing steps. It was redesigned from the Wikimedia Commons file: Cloud Testing steps.png. [commons.wikimedia.org/ wiki/ File:Cloud_ Testing_ steps.png]
This file is licensed under the Creative Commons Attribution-Share Alike 3.0 Unported license. [creativecommons.org/ licenses/ by-sa/ 3.0/ deed.en]
"Cloud testing is a form of software testing in which web applications use cloud computing environments (a "cloud") to simulate real-world user traffic. ...
Cloud Testing uses cloud infrastructure for software testing. Organizations pursuing testing in general and load, performance testing and production service monitoring in particular are challenged by several problems like limited test budget, meeting deadlines, high costs per test, large number of test cases, and little or no reuse of tests and geographical distribution of users add to the challenges. Moreover ensuring high quality service delivery and avoiding outages requires testing in one's datacenter, outside the data-center, or both. Cloud Testing is the solution to all these problems. Effective unlimited storage, quick availability of the infrastructure with scalability, flexibility and availability of distributed testing environment reduce the execution time of testing of large applications and lead to cost-effective solutions." [Cloud testing. Wikipedia]
The step chart example "Cloud testing steps" was created using the ConceptDraw PRO diagramming and vector drawing software extended with the Marketing Diagrams solution from the Marketing area of ConceptDraw Solution Park.
Marketing diagram
Basic Diagramming


Types of Flowcharts


This step chart sample shows engineering value chain. It was designed on the base of the Wikimedia Commons file: The engineering value chain.png. "The engineering value chain (EVC) refers to a series of engineering activities and capabilities contributing to value creation encompassing essential elements such as idea generation & selection, design & development, production & delivery, service & support, and disposal & recycling for example." [commons.wikimedia.org/ wiki/ File:The_ engineering_ value_ chain.png]
This file is licensed under the Creative Commons Attribution-Share Alike 3.0 Unported license. [creativecommons.org/ licenses/ by-sa/ 3.0/ deed.en]
The diagram example "Step chart - Value chain" was created using the ConceptDraw PRO diagramming and vector drawing software extended with the Marketing Diagrams solution from the Marketing area of ConceptDraw Solution Park.
Marketing diagram

 Block Diagrams
Block diagrams solution extends ConceptDraw PRO software with templates, samples and libraries of vector stencils for drawing the block diagrams.
- Block diagram - Selling technology patent process
- Block Chart Template
- Product Life Cycle Block Diagram
- Block diagram - Selling technology patent process
- Create Block Diagram | Process Flowchart | Block diagram - Selling ...
- Sales Process Flowchart. Flowchart Examples | Block diagram ...
- Flowcharts | Marketing diagrams - Vector stencils library | Process ...
- Step chart - Template | Step chart - Cloud testing steps | Step chart ...
- Block Diagrams
- Block Diagram For The Steps Of Control Process Of The Organization
- Process Flowchart | Block diagram - Selling technology patent ...
- Block diagram - Selling technology patent process | Block diagram ...
- Block diagram - Selling technology patent process | Stars and ...
- Step chart - Template | Audit Steps | Basic Flowchart Symbols and ...
- Marketing diagrams - Vector stencils library | Block diagram - Six ...
- Block diagram - Porter's five forces model
- Sales Process Flowchart. Flowchart Examples | Block diagram ...
- Sales Process Flowchart. Flowchart Examples | Block diagram ...
- Marketing diagrams - Vector stencils library | Marketing Diagrams ...
- Loyalty - Arrow circle diagram | Marketing diagrams - Vector stencils ...
- ERD | Entity Relationship Diagrams, ERD Software for Mac and Win
- Flowchart | Basic Flowchart Symbols and Meaning
- Flowchart | Flowchart Design - Symbols, Shapes, Stencils and Icons
- Flowchart | Flow Chart Symbols
- Electrical | Electrical Drawing - Wiring and Circuits Schematics
- Flowchart | Common Flowchart Symbols
- Flowchart | Common Flowchart Symbols