"Smaller mobile devices such as PDAs and smartphones typically use the WIMP elements with different unifying metaphors, due to constraints in space and available input devices. Applications for which WIMP is not well suited may use newer interaction techniques, collectively named as post-WIMP user interfaces.
As of 2011, some touch-screen-based operating systems such as Apple's iOS (iPhone) and Android use the class of GUIs named post-WIMP. These support styles of interaction using more than one finger in contact with a display, which allows actions such as pinching and rotating, which are unsupported by one pointer and mouse." [Graphical user interface. Wikipedia]
"In computing post-WIMP comprises work on user interfaces, mostly graphical user interfaces, which attempt to go beyond the paradigm of windows, icons, menus and a pointing device, i.e. WIMP interfaces. ...
However WIMP interfaces are not optimal for working with complex tasks such as computer-aided design, working on large amounts of data simultaneously, or interactive games. WIMPs are usually pixel-hungry, so given limited screen real estate they can distract attention from the task at hand. Thus, custom interfaces can better encapsulate workspaces, actions, and objects for specific complex tasks. Applications for which WIMP is not well suited include those requiring continuous input signals, showing 3D models, or simply portraying an interaction for which there is no defined standard widget.
Interfaces based on these considerations, now called "post-WIMP", have made their way to the general public. Examples include the interface of the classic MP3 player iPod and a bank's automated teller machine screen." [Post-WIMP. Wikipedia]
The example "iPhone OS (iOS) graphic user interface (GUI) - Activity indicator view" was created using the ConceptDraw PRO diagramming and vector drawing software extended with the Graphic User Interface solution from the Software Development area of ConceptDraw Solution Park.
iPhone GUI
-graphic-user-interface-(gui)---activity-indicator-view.png--diagram-flowchart-example.png)
This financila dashboard example was drawn on the base of the Enterprise dashboard from the Mecklenburg County Government website.
[charmeck.org/ mecklenburg/ county/ CountyManagersOffice/ OMB/ dashboards/ Pages/ Enterprise.aspx]
"In management information systems, a dashboard is "an easy to read, often single page, real-time user interface, showing a graphical presentation of the current status (snapshot) and historical trends of an organization’s key performance indicators to enable instantaneous and informed decisions to be made at a glance."
For example, a manufacturing dashboard may show key performance indicators related to productivity such as number of parts manufactured, or number of failed quality inspections per hour. Similarly, a human resources dashboard may show KPIs related to staff recruitment, retention and composition, for example number of open positions, or average days or cost per recruitment.
Types of dashboards.
Dashboard of Sustainability screen shot illustrating example dashboard layout.
Digital dashboards may be laid out to track the flows inherent in the business processes that they monitor. Graphically, users may see the high-level processes and then drill down into low level data. This level of detail is often buried deep within the corporate enterprise and otherwise unavailable to the senior executives.
Three main types of digital dashboard dominate the market today: stand alone software applications, web-browser based applications, and desktop applications also known as desktop widgets. The last are driven by a widget engine.
Specialized dashboards may track all corporate functions. Examples include human resources, recruiting, sales, operations, security, information technology, project management, customer relationship management and many more departmental dashboards.
Digital dashboard projects involve business units as the driver and the information technology department as the enabler. The success of digital dashboard projects often depends on the metrics that were chosen for monitoring. Key performance indicators, balanced scorecards, and sales performance figures are some of the content appropriate on business dashboards." [Dashboard (management information systems). Wikipedia]
The example "Enterprise dashboard" was created using the ConceptDraw PRO diagramming and vector drawing software extended with the Composition Dashboard solution from the area "What is a Dashboard" of ConceptDraw Solution Park.
Financial dashboard

HelpDesk
How to Connect a Live Object to a Text Data Source


The vector stencils library "Meter indicators" contains 29 Live Objects: speedometer gauge, dial, bullet graph, slider and level meter visual indicators.
The Live Objects designed to display actual measures of performance metrics and KPIs from external data source files.
Some of them also display comparative measures, and colored zones of qualitative ranges with legend.
Use it to draw business performance dashboards using the ConceptDraw PRO diagramming and vector drawing software .
"Digital dashboards may be laid out to track the flows inherent in the business processes that they monitor. Graphically, users may see the high-level processes and then drill down into low level data. This level of detail is often buried deep within the corporate enterprise and otherwise unavailable to the senior executives. ...
Specialized dashboards may track all corporate functions. Examples include human resources, recruiting, sales, operations, security, information technology, project management, customer relationship management and many more departmental dashboards. ...
Like a car's dashboard (or control panel), a software dashboard provides decision makers with the input necessary to "drive" the business. Thus, a graphical user interface may be designed to display summaries, graphics (e.g., bar charts, pie charts, bullet graphs, "sparklines," etc.), and gauges (with colors similar to traffic lights) in a portal-like framework to highlight important information. ...
Digital dashboards allow managers to monitor the contribution of the various departments in their organization. To gauge exactly how well an organization is performing overall, digital dashboards allow you to capture and report specific data points from each department within the organization, thus providing a "snapshot" of performance." [Dashboard (management information systems). Wikipedia]
The example "Design elements - Meter indicators" is included in the Meter Dashboard solution from the area "What is a Dashboard" of ConceptDraw Solution Park.
Visual indicators

"As a discipline, task management embraces several key activities. Various conceptual breakdowns exist, and these, at a high-level, always include creative, functional, project, performance and service activities.
Creative activities pertain to task creation. In context, these should allow for task planning, brainstorming, creation, elaboration, clarification, organization, reduction, targeting and preliminary prioritization.
Functional activities pertain to personnel, sales, quality or other management areas, for the ultimate purpose of ensuring production of final goods and services for delivery to customers. In context these should allow for planning, reporting, tracking, prioritizing, configuring, delegating, and managing of tasks.
Project activities pertain to planning and time and costs reporting. These can encompass multiple functional activities but are always greater and more purposeful than the sum of its parts. In context project activities should allow for project task breakdown, task allocation, inventory across projects, and concurrent access to task databases.
Service activities pertain to client and internal company services provision, including customer relationship management and knowledge management. In context these should allow for file attachment and links to tasks, document management, access rights management, inventory of client & employee records, orders & calls management, and annotating tasks.
Performance activities pertain to tracking performance and fulfillment of assigned tasks. In context these should allow for tracking by time, cost control, stakeholders and priority; charts, exportable reports, status updates, deadline adjustments, and activity logging.
Report activities pertain to the presentation of information regarding the other five activities listed, including graphical display." [Task management. Wikipedia]
The example "Project tasks dashboard" was created using the ConceptDraw PRO diagramming and vector drawing software extended with the Status Dashboard solution from the area "What is a Dashboard" of ConceptDraw Solution Park.
Project tasks dashboard

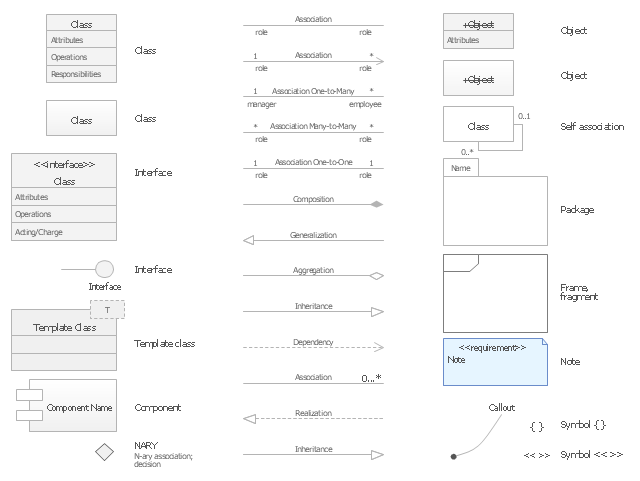
The vector stencils library "UML class diagrams" contains 38 symbols for the ConceptDraw PRO diagramming and vector drawing software.
"... classes are represented with boxes which contain three parts:
(1) The top part contains the name of the class. It is printed in Bold, centered and the first letter capitalized.
(2) The middle part contains the attributes of the class. They are left aligned and the first letter is lower case.
(3) The bottom part gives the methods or operations the class can take or undertake. They are also left aligned and the first letter is lower case. ...
To indicate a classifier scope for a member, its name must be underlined. ...
An association can be named, and the ends of an association can be adorned with role names, ownership indicators, multiplicity, visibility, and other properties. ...
Aggregation ... is graphically represented as a hollow diamond shape on the containing class end of the tree with a single line that connects the contained class to the containing class.
... graphical representation of a composition relationship is a filled diamond shape on the containing class end of the tree of lines that connect contained class(es) to the containing class.
... graphical representation of a Generalization is a hollow triangle shape on the superclass end of the line (or tree of lines) that connects it to one or more subtypes.
... graphical representation of a Realization is a hollow triangle shape on the interface end of the dashed line (or tree of lines) that connects it to one or more implementers. A plain arrow head is used on the interface end of the dashed line that connects it to its users.
Multiplicity ... representation of an association is a line with an optional arrowhead indicating the role of the object(s) in the relationship, and an optional notation at each end indicating the multiplicity of instances of that entity (the number of objects that participate in the association).
Entity classes ... are drawn as circles with a short line attached to the bottom of the circle. Alternatively, they can be drawn as normal classes with the «entity» stereotype notation above the class name." [Class diagram. Wikipedia]
The example "Design elements - UML class diagrams" is included in the Rapid UML solution from the Software Development area of ConceptDraw Solution Park.
UML class diagram symbols
The vector stencils library "Menus" contains 14 icons of Windows 8 menus.
Use this menu UI icon set to design graphic user interface (GUI) prototypes of your software applications for Windows 8.
"A menu bar is a graphical control element which contains drop down menus. The menu bar's purpose is to supply a common housing for window- or application-specific menus which provide access to such functions as opening files, interacting with an application, or displaying help documentation or manuals. Menu bars are typically present in graphical user interfaces that display documents and representations of files in windows and windowing systems but menus can be used as well in command line interface programs like text editors or filemanagers where drop-down menu is activated with shortcut key or combination. ...
The menu bar in Microsoft Windows is usually anchored to the top of a window under the title bar; therefore, there can be many menu bars on screen at one time. Menus in the menu bar can be accessed through shortcuts involving the Alt key and the mnemonic letter that appears underlined in the menu title. Additionally, pressing Alt or F10 brings the focus on the first menu of the menu bar." [Menu bar. Wikipedia]
The menu elements example "Menus - Vector stencils library" was created using the ConceptDraw PRO diagramming and vector drawing software extended with the Windows 8 User Interface solution from the Software Development area of ConceptDraw Solution Park.
Menu bar
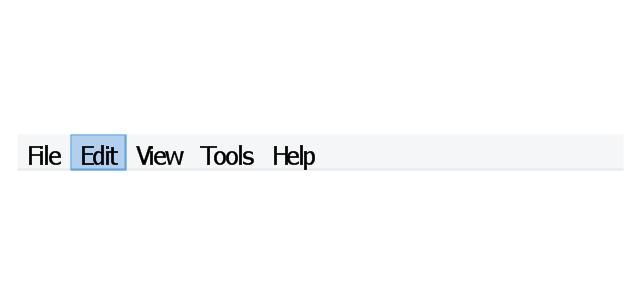
Menu category

Menu category - selected

Menu bar background
Drop-down menu
Separator line

Check
Option
Menu item

Menu item - selected
Menu item - disabled

Arrow indicator
Menu item with arrow
Menu item with arrow - selected
What is Gantt Chart (historical reference)

- Quality Status Indicator Graphics
- Status Dashboard | Project task status dashboard - Template | PM ...
- Status Dashboard | Status indicators - Vector stencils library | Project ...
- Status indicators - Vector stencils library | Design elements - Status ...
- Graphical Presentation Of Current Trends In Business Management
- Status Dashboard | Project task status dashboard | Seven ...
- Status Dashboard | Construction Project Chart Examples | How to ...
- Project Status In Speedometer
- iPhone OS (iOS) graphic user interface (GUI) - Activity indicator view ...
- Basic Flowchart Symbols and Meaning | Status Dashboard | PM ...
- Status Dashboard | PM Dashboards | Project task status dashboard ...
- Basic Flowchart Symbols and Meaning | Dashboard | Graphical ...
- Project Report On Atm Status Indicator
- Project Status Indicator
- Design elements - Status indicators | Status Dashboard | iPhone OS ...
- Status Dashboard | Design elements - Composition charts and ...
- How to Create a Sales Dashboard Using ConceptDraw PRO | Status ...
- Status Dashboard | How To Create Project Report | Project tasks ...
- Design elements - Status indicators | How To Hold Project ...
- How To Show Project Progress Peport on Web | Project task status ...
- ERD | Entity Relationship Diagrams, ERD Software for Mac and Win
- Flowchart | Basic Flowchart Symbols and Meaning
- Flowchart | Flowchart Design - Symbols, Shapes, Stencils and Icons
- Flowchart | Flow Chart Symbols
- Electrical | Electrical Drawing - Wiring and Circuits Schematics
- Flowchart | Common Flowchart Symbols
- Flowchart | Common Flowchart Symbols