Winter Sports. Illustrations and Visualize Statistics

This marketing infogram example was created on the base of data of "The EU in the world 2014. A statistical portrai" from the website of the Eurostat - the statistical office of the European Union situated in Luxembourg.
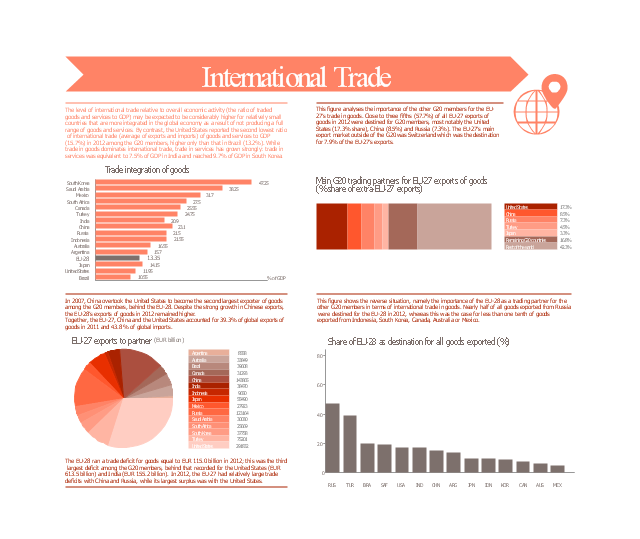
"In 2007, China overtook the United States to become the second largest exporter of goods among the G20 members, behind the EU-28. Despite the strong growth in Chinese exports, the EU-28’s exports of goods in 2012 remained higher.
Together, the EU-27, China and the United States accounted for 39.3% of global exports of goods in 2011 and 43.8 % of global imports."
[epp.eurostat.ec.europa.eu/ cache/ ITY_ OFFPUB/ KS-EX-14-001/ EN/ KS-EX-14-001-EN.PDF]
The marketing infographic example "International trade statistics - EU in comparison with the Group of Twenty" was created using the ConceptDraw PRO diagramming and vector drawing software extended with the Marketing Infographics solition from the area "Business Infographics" in ConceptDraw Solution Park.
Marketing infogram
This typography infographics example was redesigned from the Wikimedia Commons file: How ONS statistics explain the UK economy Feb 2012 (8790240798).jpg. [commons.wikimedia.org/ wiki/ File:How_ ONS_ statistics_ explain_ the_ UK_ economy_ Feb_ 2012_ %288790240798%29.jpg]
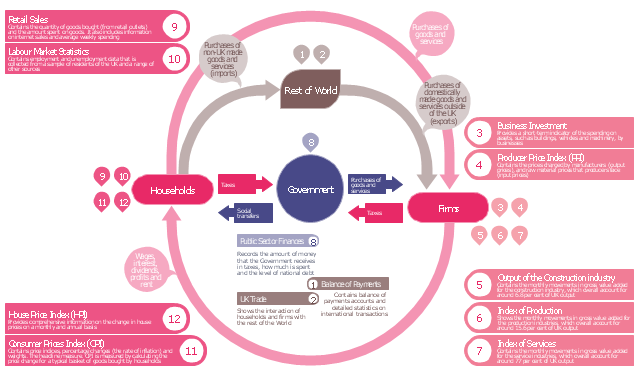
The circular flow of income shows how financial payments flow between firms and households within the economy. It also shows the interaction between different sectors of the economy and the rest of the world. Gross domestic product (GDP) measures the total output of the UK economy, and the quarterly national accounts build this into a complete picture of all the transactions shown in the graphic." [Office for National Statistics (ONS) website: ons.gov.uk/ ons/ interactive/ ons-statistics-products/ index.html]
The infographics example "How ONS statistics explain the UK economy Feb 2012" was created using the ConceptDraw PRO diagramming and vector drawing software extended with the Typography Infographics solition from the area "What is infographics" in ConceptDraw Solution Park.
Infographics
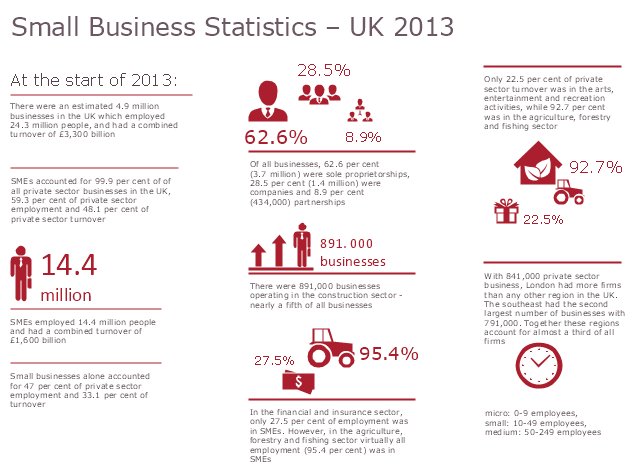
This infogram sample was created on the base of statistics data from the website of the Federation of Small Businesses (FSB), UK. [fsb.org.uk/ stats]
The infographics example "Small Business Statistics – UK 2013" was created using the ConceptDraw PRO diagramming and vector drawing software extended with the Pictorial Infographic solition from the area "What is infographics" in ConceptDraw Solution Park.
The infographics example "Small Business Statistics – UK 2013" was created using the ConceptDraw PRO diagramming and vector drawing software extended with the Pictorial Infographic solition from the area "What is infographics" in ConceptDraw Solution Park.
Pictorial infogram
Winter Sports. Using Winter Sports Design Elements Producing Infographics

Sample Pictorial Chart. Sample Infographics
")
Use Pictorial Infographics solution to draw your own design pictorial infographics documents quick and easy.
2 Circle Venn Diagram. Venn Diagram Example

Relative Value Chart Software

Relative values are widely used in:business, economics, investment, management, marketing, statistics, etc.
ConceptDraw PRO software is the best for drawing professional looking Relative Value Charts. ConceptDraw PRO provides Divided Bar Diagrams solution from the Graphs and Charts Area of ConceptDraw Solution Park.
3 Circle Venn. Venn Diagram Example

Venn Diagram Template for Word

How to Draw Pictorial Chart. How to Use Infograms

Pictorial Infographics solution contains large number of libraries with variety of predesigned vector pictograms that allows you design infographics in minutes. There are available 10 libraries with 197 vector pictograms.
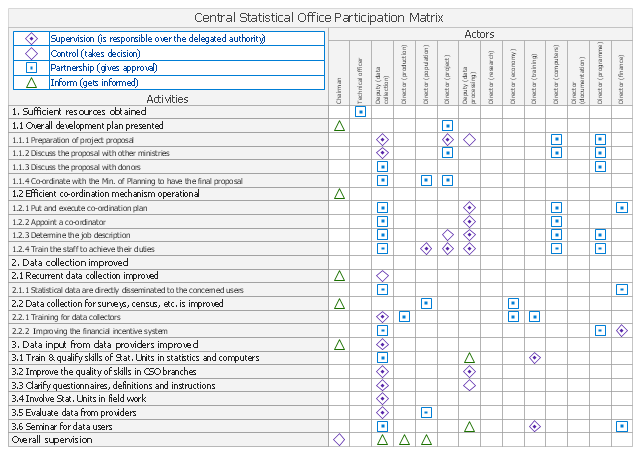
"A responsibility assignment matrix (RAM), also known as RACI matrix or ARCI matrix or linear responsibility chart (LRC), describes the participation by various roles in completing tasks or deliverables for a project or business process. It is especially useful in clarifying roles and responsibilities in cross-functional/ departmental projects and processes.
RACI and ARCI are acronyms derived from the four key responsibilities most typically used: Responsible, Accountable, Consulted, and Informed. ...
The matrix is typically created with a vertical axis (left-hand column) of tasks (e.g., from a work breakdown structure WBS) or deliverables (e.g., from a product breakdown structure PBS), and a horizontal axis (top row) of roles (e.g., from an organizational chart)" [Responsibility assignment matrix. Wikipedia]
The responsibility assignment matrix example "Central statistical office" was created using the ConceptDraw PRO diagramming and vector drawing software extended with the solution "Seven Management and Planning Tools" from the Management area of ConceptDraw Solution Park.
Involvement matrix
Content Marketing Infographics

Information Graphics

Infographic Software

- Winter Sports. Illustrations and Visualize Statistics | Workflow ...
- Winter Sports. Illustrations and Visualize Statistics | Winter Sports ...
- Winter Sports. Illustrations and Visualize Statistics | Spatial ...
- Winter Sports. Illustrations and Visualize Statistics | Information ...
- Winter Sports | Winter Sports. Illustrations and Visualize Statistics ...
- Sport pictograms. Olympic Games | Winter Sports. Illustrations and ...
- International trade statistics - EU in comparison with the Group of ...
- Winter Sports. Illustrations and Visualize Statistics | Sport pictograms ...
- Nordic combined - Winter sports pictograms | Winter Sports ...
- Winter Olympics - Alpine skiing | Winter Sports | Winter Sports ...
- Ice Hockey | Winter Sports | Winter Sports. Illustrations and Visualize ...
- Computers and Communications | Winter Sports. Illustrations and ...
- Pie Graph Worksheets | Pie Charts | How To Draw Statistics Chart Of ...
- Business Statistics Diagram
- Small Business Statistics – UK 2013
- Business Statistics Examples
- How ONS statistics explain the UK economy Feb 2012
- How Are Statistical Comparisons Shown On Bar Graphs
- Statistics Map Template
- Pie Chart Software | Doughnut chart - Template | Donut Chart ...
- ERD | Entity Relationship Diagrams, ERD Software for Mac and Win
- Flowchart | Basic Flowchart Symbols and Meaning
- Flowchart | Flowchart Design - Symbols, Shapes, Stencils and Icons
- Flowchart | Flow Chart Symbols
- Electrical | Electrical Drawing - Wiring and Circuits Schematics
- Flowchart | Common Flowchart Symbols
- Flowchart | Common Flowchart Symbols