Seven Basic Tools of Quality - Quality Control

The library of vector stencils "Fishbone diagrams" contains 13 symbols for drawing the Ishikawa diagrams using the ConceptDraw PRO diagramming and vector drawing software.
"Ishikawa diagrams were popularized by Kaoru Ishikawa in the 1960s, who pioneered quality management processes in the Kawasaki shipyards, and in the process became one of the founding fathers of modern management.
The basic concept was first used in the 1920s, and is considered one of the seven basic tools of quality control. It is known as a fishbone diagram because of its shape, similar to the side view of a fish skeleton." [Ishikawa diagram. Wikipedia]
"The Seven Basic Tools of Quality is a designation given to a fixed set of graphical techniques identified as being most helpful in troubleshooting issues related to quality. They are called basic because they are suitable for people with little formal training in statistics and because they can be used to solve the vast majority of quality-related issues.
The seven tools are:
(1) Cause-and-effect diagram (also known as the "fishbone" or Ishikawa diagram);
(2) Check sheet;
(3) Control chart;
(4) Histogram;
(5) Pareto chart;
(6) Scatter diagram;
(7) Stratification (alternately, flow chart or run chart)." [Seven Basic Tools of Quality. Wikipedia]
The example "Design elements - Fishbone diagram" is included in the Fishbone Diagrams solution from the Management area of ConceptDraw Solution Park.
Ishikawa diagram symbols

Quality Management System

 Seven Basic Tools of Quality
Manage quality control in the workplace, using fishbone diagrams, flowcharts, Pareto charts and histograms, provided by the Seven Basic Tools of Quality solution.
Organizational Structure Total Quality Management

Total Quality Management with ConceptDraw
 method - Fishbone diagram template")
Seven Basic Tools of Quality - Histogram

ConceptDraw PRO diagramming and vector drawing software offers a powerful Seven Basic Tools of Quality solution from the Quality area of ConceptDraw Solution Park which contains a set of useful tools for easy drawing Histogram and other quality related diagrams of any complexity.
A Study of the Business Value of Total Quality Management

 Block Diagrams
Block diagrams solution extends ConceptDraw PRO software with templates, samples and libraries of vector stencils for drawing the block diagrams.
 Marketing Area
The solutions from Marketing area of ConceptDraw Solution Park collect templates, samples and libraries of vector stencils for drawing the marketing diagrams and mind maps.
 Marketing Diagrams
This solution extends ConceptDraw PRO with samples, templates and library of design elements for drawing the marketing diagrams.
 Sales Dashboard
Sales Dashboard solution extends ConceptDraw PRO software with templates, samples and library of vector stencils for drawing the visual dashboards of sale metrics and key performance indicators (KPI).
The vector stencils library "HR symbols" contains 45 HR pictograms.
Use this icon set with HR symbols to draw your HR flowcharts, workflow diagrams, process charts and infographics with the ConceptDraw PRO diagramming and vector drawing software.
The HR pictograms library "HR symbols" is included in the HR Flowcharts solution from the Management area of ConceptDraw Solution Park.
Absence management

Absenteeism

Achievement

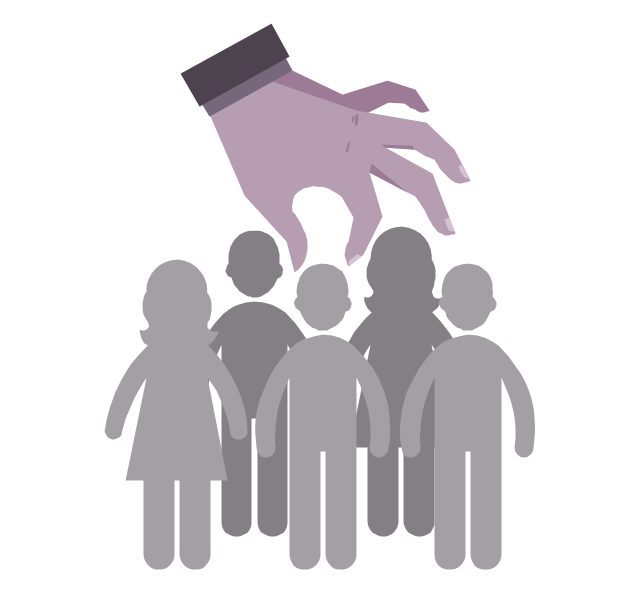
Attract

Authority and accountability
Business goals

Business success

Capital formation

Career

Career ladder

Communication

Compensation management
Conflict management

Conformance

Dress code

Education

Global HR

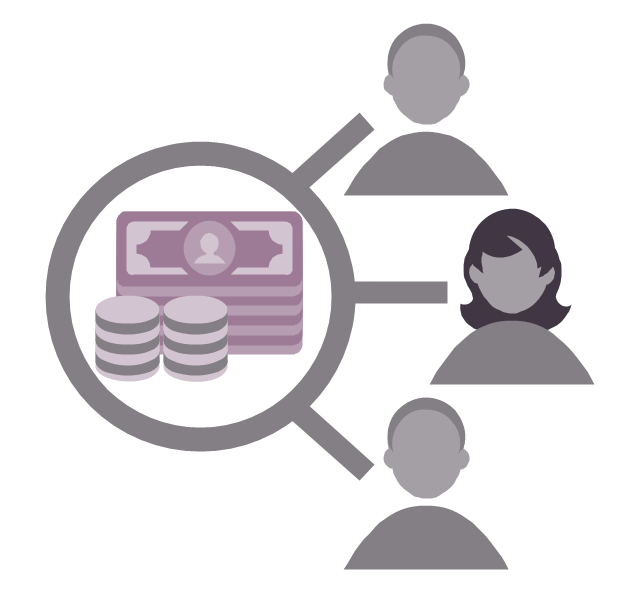
Headhunting

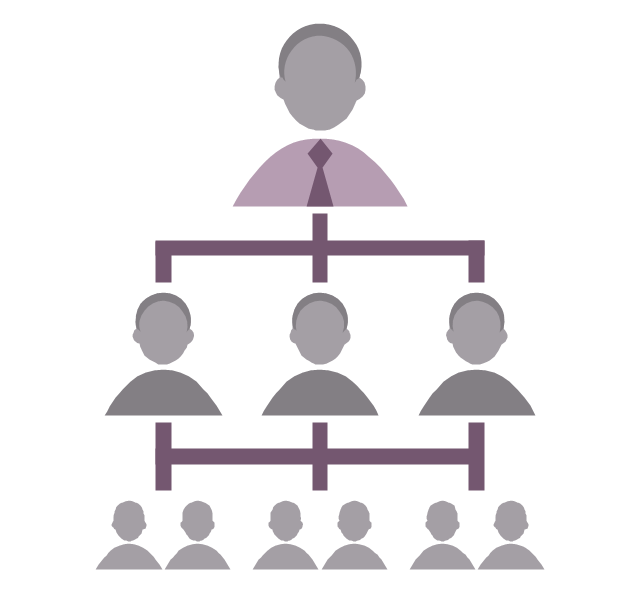
Hierarchical organization
Human capital

Human resource management

Incentive compensation management

Increase productivity

Job performance

Job satisfaction

Labor Unions

Leadership

Motivation and incentives

Organizational culture

Partnership

Performance management
Problem solving

Retention

Skill

Smart ideas

Staff turnover

Succession management

Talent acquisition

Time efficiency

Time management

Timekeeping

Winner

Workforce planning
Workplace culture

Workplace health and safety

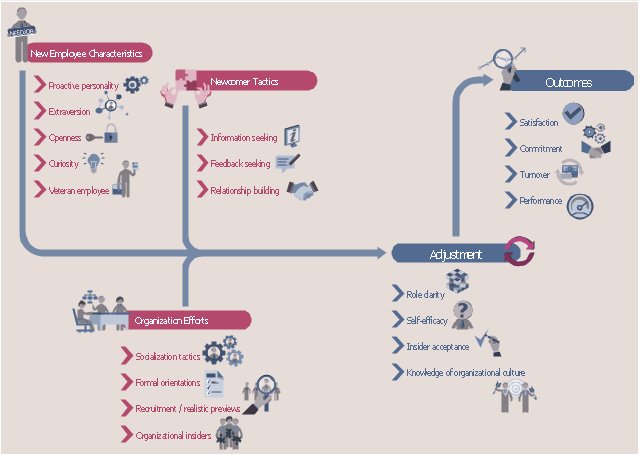
HR infographics "Onboarding model" was redesigned from the Wikimedia Commons file: Organizationalsocializationmodel.jpg. [commons.wikimedia.org/ wiki/ File:Organizationalsocializationmodel.jpg]
This file is licensed under the Creative Commons Attribution-Share Alike 3.0 Unported license. [creativecommons.org/ licenses/ by-sa/ 3.0/ ]
"Onboarding, also known as organizational socialization, refers to the mechanism through which new employees acquire the necessary knowledge, skills, and behaviors to become effective organizational members and insiders. Tactics used in this process include formal meetings, lectures, videos, printed materials, or computer-based orientations to introduce newcomers to their new jobs and organizations. Research has demonstrated that these socialization techniques lead to positive outcomes for new employees such as higher job satisfaction, better job performance, greater organizational commitment, and reduction in occupational stress and intent to quit. These outcomes are particularly important to an organization looking to retain a competitive advantage in an increasingly mobile and globalized workforce." [Onboarding. Wikipedia]
The HR infographics example "Onboarding model" was created using the ConceptDraw PRO diagramming and vector drawing software extended with the HR Flowcharts solution from the Management area of ConceptDraw Solution Park.
HR Infographics
- Block diagram - Sources of customer satisfaction | Marketing ...
- Block diagram - Sources of customer satisfaction | Virtuous circle ...
- Stratification diagram example
- Process Flowchart | Cause and Effect Analysis | Total Quality ...
- Block diagram - Porter's five forces model | Process Flowchart ...
- Block diagram - Sources of customer satisfaction | Marketing ...
- UML object diagram - Estimating scenario
- Stratification Run Chart Tool Of Quality
- Basic Flowchart Symbols and Meaning | Process Flowchart ...
- Block diagram - Sources of customer satisfaction | IVR customer ...
- Basic Flowchart Symbols and Meaning | Flowchart design ...
- Customer types matrix | Response to Customer Negative Feedback ...
- Process Flowchart | Mechanical Drawing Symbols | Basic Flowchart ...
- Seven Basic Tools of Quality | Seven Basic Tools of Quality - Flow ...
- Process Flowchart | Probability Quality Control Tools | Basic ...
- Basic Flowchart Symbols and Meaning | Entity Relationship ...
- Basic Flowchart Symbols and Meaning | Process Flowchart | Design ...
- Basic Flowchart Symbols and Meaning | Workflow Diagram Symbols ...
- Leaky bucket diagram | Six Markets Model Chart | Pyramid Diagram ...
- Data Flow Diagram (DFD)
- ERD | Entity Relationship Diagrams, ERD Software for Mac and Win
- Flowchart | Basic Flowchart Symbols and Meaning
- Flowchart | Flowchart Design - Symbols, Shapes, Stencils and Icons
- Flowchart | Flow Chart Symbols
- Electrical | Electrical Drawing - Wiring and Circuits Schematics
- Flowchart | Common Flowchart Symbols
- Flowchart | Common Flowchart Symbols