Visualize Stakeholder Analysis

Use the ConceptDraw DIAGRAM diagramming and vector drawing software enhanced with powerful tools of Stakeholder Onion Diagrams Solution from the Management Area of ConceptDraw Solution Park to easy and effectively visualize stakeholder analysis.
Stakeholder Mapping Tool

ConceptDraw DIAGRAM diagramming and vector drawing software extended with Stakeholder Onion Diagrams Solution from the Management Area of ConceptDraw Solution Park is a powerful stakeholder mapping tool which allows easy create Stakeholder Onion diagrams and maps depicting the layers of a project, relationships of stakeholders to a project goal, and relationships between stakeholders.
Stakeholder Onion Diagrams

Design fast and easy Stakeholder Onion Diagrams of any complexity in ConceptDraw DIAGRAM diagramming and vector drawing software using the powerful tools of Stakeholder Onion Diagrams Solution from the Management Area of ConceptDraw Solution Park.
 Stakeholder Onion Diagrams
The Stakeholder Onion Diagram is often used as a way to view the relationships of stakeholders to a project goal. A basic Onion Diagram contains a rich information. It shows significance of stakeholders that will have has influence to the success achieve
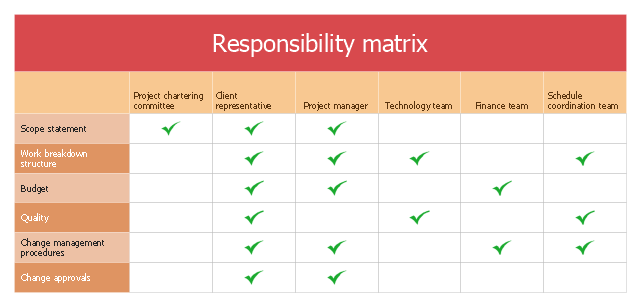
The responsibility matrix depicts key actions and decisions, main stakeholders and key responsibilities. Key activities are listed in the left most column, in approximate sequential order. Key stakeholders are listed as column headings above the next set of columns. For each row of action steps, a symbol is shown in the column for relevant stakeholders indicating who has responsibility for the step, who is involved. [anao.gov.au/ html/ Files/ BPG HTML/ Developing and Managing Contracts/ 2_ action_ matrix.html]
The involvement matrix example "Distribution of responsibilities" was created using the ConceptDraw PRO diagramming and vector drawing software extended with the solution "Seven Management and Planning Tools" from the Management area of ConceptDraw Solution Park.
The involvement matrix example "Distribution of responsibilities" was created using the ConceptDraw PRO diagramming and vector drawing software extended with the solution "Seven Management and Planning Tools" from the Management area of ConceptDraw Solution Park.
Involvement matrix
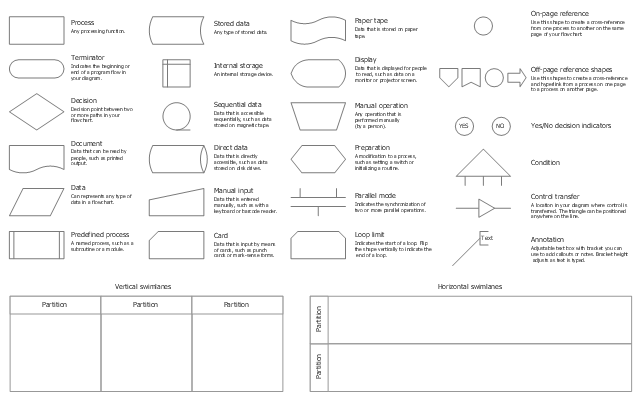
The vector stencils library "Cross-functional flowcharts" contains 31 symbols for creating the deployment flow charts using the ConceptDraw PRO diagramming and vector drawing software.
"A deployment flowchart (sometimes referred to as a "cross functional flowchart") is a business process mapping tool used to articulate the steps and stakeholders of a given process. ...
As deployment flowcharts highlight the relationships between stakeholders in addition to the process flow they are especially useful in highlighting areas of inefficiency, duplication or unnecessary processing. Often utilized within Six sigma activity, completed flowcharts are commonly used to examine the interfaces between “participants” which are typically causes for delays and other associated issues. Deployment flowcharts are useful for determining who within an organization is required to implement a process and are sometimes used as a business planning tool." [Deployment flowchart. Wikipedia]
The example "Design elements - Cross-functional flowcharts" is included in the Cross-Functional Flowcharts solution from the Business Processes area of ConceptDraw Solution Park.
Cross-functional flowchart shapes
The vector stencils library "Target diagrams" contains 13 templates of target diagrams: marketing mix diagram, principles of marketing diagram, circle diagram, macro-micro environment diagram, stakeholder diagram, target market scope diagram.
Use these shapes to illustrate your marketing and sales documents, presentations, webpages and infographics in the ConceptDraw PRO diagramming and vector drawing software extended with the Target and Circular Diagrams solution from the Marketing area of ConceptDraw Solution Park.
www.conceptdraw.com/ solution-park/ marketing-target-and-circular-diagrams
Principles of marketing by Ph. Kotler

Marketing mix

Target

Principles of marketing by Ph. Kotler (prompt)
-target-diagrams---vector-stencils-library.png--diagram-flowchart-example.png)
Circle diagram

Macro-micro environmental forces diagram

Macro-micro environmental forces diagram (prompt)
-target-diagrams---vector-stencils-library.png--diagram-flowchart-example.png)
Stakeholder diagram

Target market scope diagram

Target diagram 1

Target diagram 2

Target diagram 3

Target diagram

Network Diagram Software. LAN Network Diagrams. Physical Office Network Diagrams


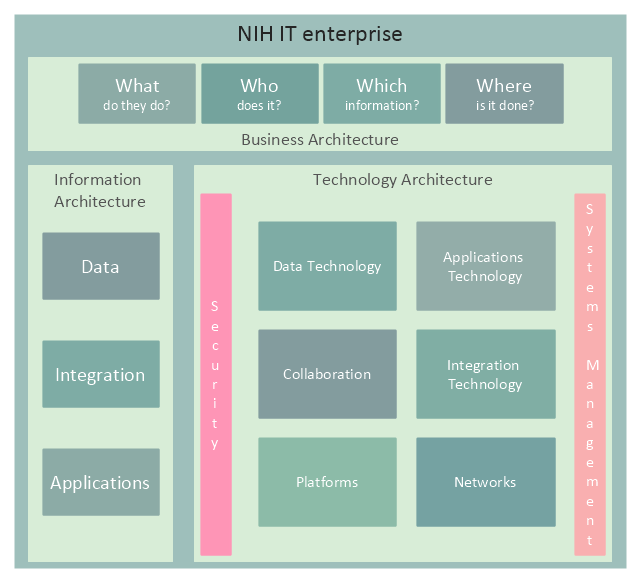
This enterprise architecture diagram sample was redesigned from the illustration of the NIH Enterprise Architecture website. [enterprisearchitecture.nih.gov/ Pages/ Framework.aspx]
"Enterprise architecture is a comprehensive framework used to manage and align an organization's Information Technology (IT) assets, people, operations, and projects with its operational characteristics. In other words, the enterprise architecture defines how information and technology will support the business operations and provide benefit for the business.
It illustrates the organization’s core mission, each component critical to performing that mission, and how each of these components is interrelated. These components include:
(1) Guiding principles,
(2) Organization structure,
(3) Business processes,
(4) People or stakeholders,
(5) Applications, data, and infrastructure,
(6) Technologies upon which networks, applications and systems are built.
Guiding principles, organization structure, business processes, and people don’t sound very technical. That’s because enterprise architecture is about more than technology. It is about the entire organization (or enterprise) and identifying all of the bits and pieces that make the organization work." [enterprisearchitecture.nih.gov/ Pages/ what.aspx]
The example "NIH IT enterprise architecture framework" was created using the ConceptDraw PRO diagramming and vector drawing software extended with the Enterprise Architecture Diagrams solution from the Management area of ConceptDraw Solution Park.
Enterprise architecture diagram
HelpDesk
How to Add a Cross-Functional Flowchart to Adobe PDF

HelpDesk
How to Make Network Diagram

HelpDesk
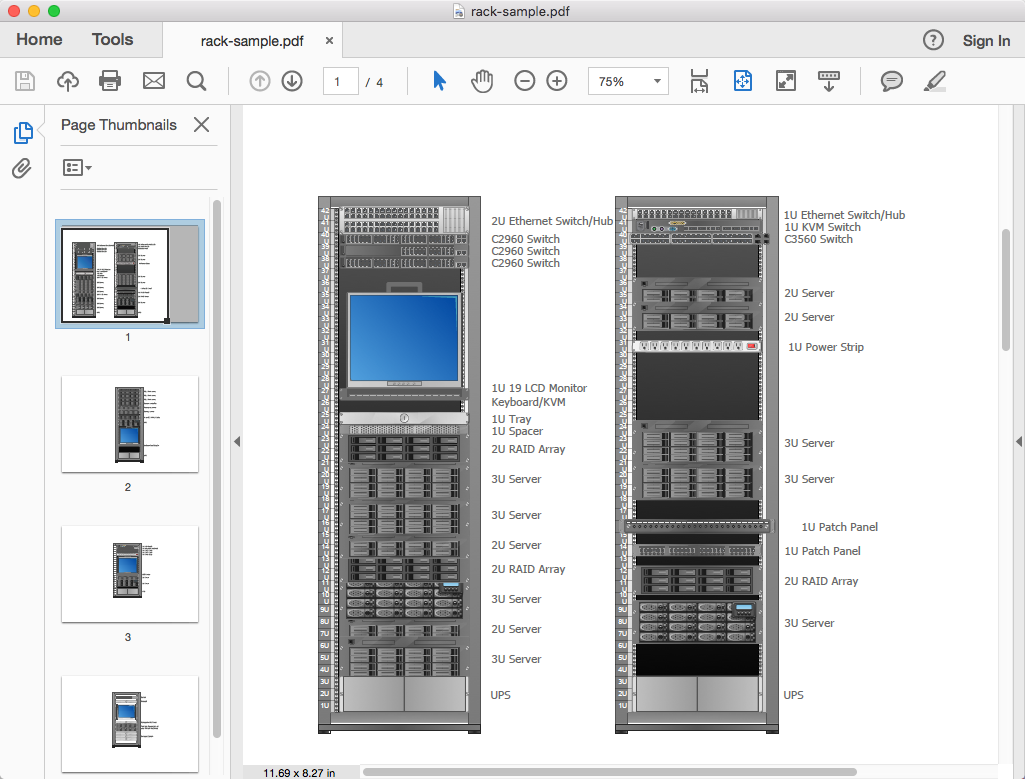
How To Convert a Rack Diagram to Adobe PDF
HelpDesk
How To Convert a Wireless Network Diagram to Adobe PDF

HelpDesk
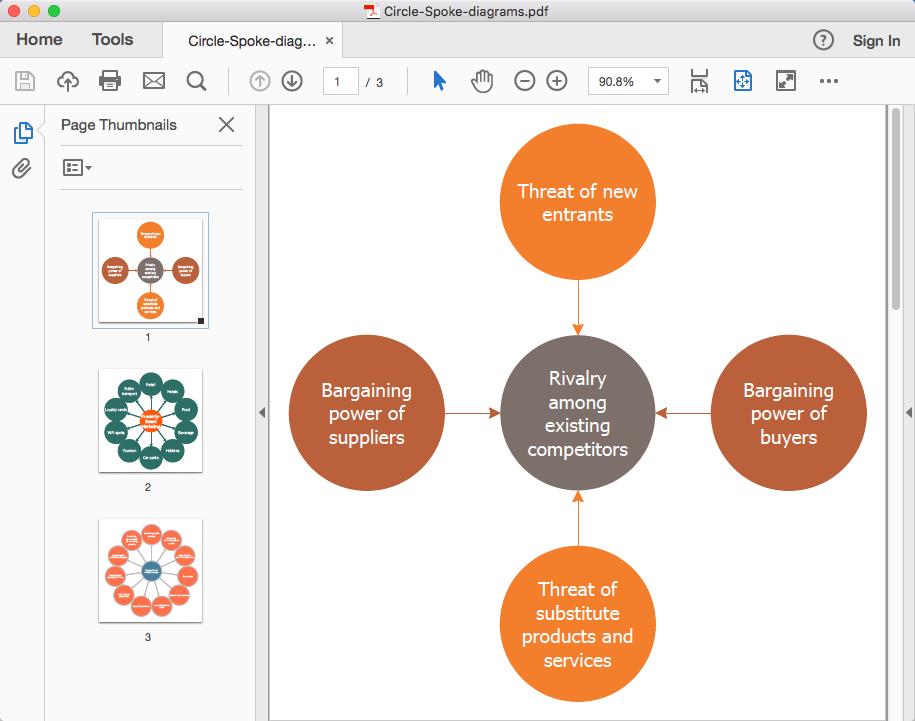
How To Convert a Circle-Spoke Diagram to Adobe PDF
HelpDesk
How To Convert a Telecommunication Network Diagram to Adobe PDF

HelpDesk
How To Convert a Block Diagram to Adobe PDF

- Stakeholder Management System | Stakeholder Onion Diagrams ...
- How To Draw Stakeholder Onion Diagram
- Visualize Stakeholder Analysis | Onion Diagram Maker ...
- Stakeholder Mapping Tool | Stakeholder Onion Diagram Template ...
- Stakeholder Onion Diagram Template
- Management Stakeholder Onion Diagrams
- Onion Diagram With 3 Sectors Template
- How To Create Stakeholder Onion Diagram
- Stakeholder Icons
- Onion Diagram Process Design | Stakeholder Onion Diagrams ...
- Network Diagram Examples | Cisco Network Design | Draw Network ...
- Network Diagram Software
- Basic Flowchart Symbols and Meaning | Process Flowchart ...
- How To Convert a Flowchart to Adobe PDF Using ConceptDraw PRO
- How To Convert a Computer Network Diagram to Adobe PDF Using ...
- Network Diagram Examples | Draw Network Diagram based on ...
- Cross Functional Flowchart Shapes Stencil | Cisco Optical. Cisco ...
- Conceptdraw.com: Mind Map Software, Drawing Tools | Project ...
- System Flowchart Symbols Pdf
- Flowchart Symbols Pdf
- ERD | Entity Relationship Diagrams, ERD Software for Mac and Win
- Flowchart | Basic Flowchart Symbols and Meaning
- Flowchart | Flowchart Design - Symbols, Shapes, Stencils and Icons
- Flowchart | Flow Chart Symbols
- Electrical | Electrical Drawing - Wiring and Circuits Schematics
- Flowchart | Common Flowchart Symbols
- Flowchart | Common Flowchart Symbols