Visualize Stakeholder Analysis

Use the ConceptDraw DIAGRAM diagramming and vector drawing software enhanced with powerful tools of Stakeholder Onion Diagrams Solution from the Management Area of ConceptDraw Solution Park to easy and effectively visualize stakeholder analysis.
Stakeholder Onion Diagrams

Design fast and easy Stakeholder Onion Diagrams of any complexity in ConceptDraw DIAGRAM diagramming and vector drawing software using the powerful tools of Stakeholder Onion Diagrams Solution from the Management Area of ConceptDraw Solution Park.
 Stakeholder Onion Diagrams
The Stakeholder Onion Diagram is often used as a way to view the relationships of stakeholders to a project goal. A basic Onion Diagram contains a rich information. It shows significance of stakeholders that will have has influence to the success achieve
Stakeholder Mapping Tool

ConceptDraw DIAGRAM diagramming and vector drawing software extended with Stakeholder Onion Diagrams Solution from the Management Area of ConceptDraw Solution Park is a powerful stakeholder mapping tool which allows easy create Stakeholder Onion diagrams and maps depicting the layers of a project, relationships of stakeholders to a project goal, and relationships between stakeholders.
Stakeholder Onion Diagram Template

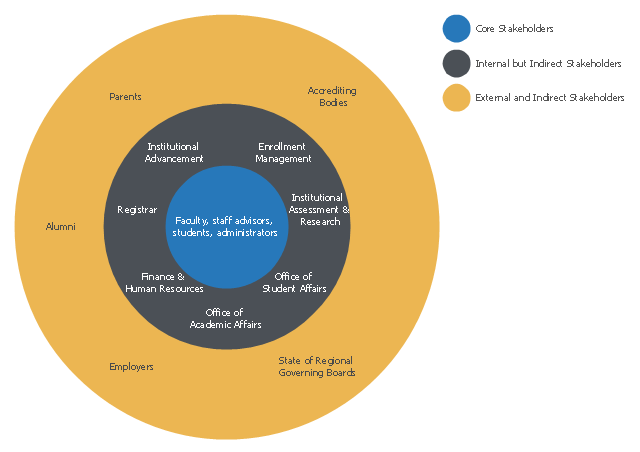
This onion diagram example was designed on the base of figure "Academic advising stakeholder framework" in the article "Defining Advising Stakeholder Groups" by Julianne Messia from the website of NACADA Executive Office,
Kansas State University.
"A complete stakeholder analysis, therefore, not only names the stakeholders but accurately characterizes each stakeholder’s power and influence.
Harney (2008) identified advising stakeholders as being either internal or external constituents. Stakeholders belong in one of three distinct classifications: (1) internal core stakeholders, (2) internal but indirect stakeholders, and (3) external and indirect stakeholders. The chart below (Figure 1) depicts these groups in a diagram representing their various levels of input, influence, and involvement; the closer a group is to the “core” the more investment and weight that group has in advising. The groups utilized in this specific example assume a shared model of advising (both faculty and advising professionals have advising responsibilities). As each institution has its own unique culture and advising model, the chart should be adapted for any program or institution. For instance, an institution with a centralized advising model may list faculty as Internal but Indirect Stakeholders as they do not provide or administer advising directly."
[nacada.ksu.edu/ Resources/ Clearinghouse/ View-Articles/ Defining-Advising-Stakeholder-Groups.aspx]
The onion diagram example "Stakeholder diagram" was drawn using the ConceptDraw PRO software extended with the Stakeholder Onion Diagrams solution from the Management area of ConceptDraw Solution Park.
Onion diagram example
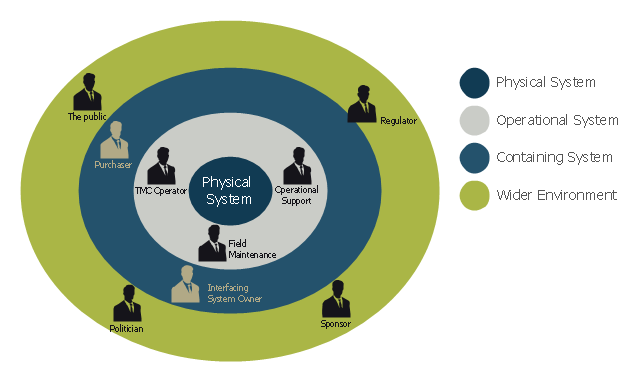
This onion diagram example was designed on the base of figure "Stakeholders for a System" in the slide presentation "A103: Introduction to ITS Standards Requirements Development" from the U.S. Department of Transportation (US DOT) website.
"“Stakeholders for a System.” A graphic of four concentric circles arranged like an archery target. The innermost circle is a reddish tan. The three bands of colors that are further from the center are in lighter shades of tan. This is called an “onion diagram” as onions are made up of multiple layers. The inner circle is labeled “Physical System.” The next layer outward is labeled “Operational System.” The next layer outward is labeled “Containing System.” The outermost layer is labeled “Wider Environment.” There are smaller black graphics of person positioned in the different layers of the diagram. Each person has a project role next to it as follows: 1) Inner Circle has no people – It represents the system; 2) Next Layer Outward has three people labeled TMC Operator, Field Maintenance, and Operational Support respectively; 3) Next Layer Outward has two people labeled Interfacing System Owner and Purchaser respectively; and 4) Outermost Layer has four people labeled Sponsor of the Project, Regulatory Agency, Public, and Politician respectively. The picture demonstrates while they are all stakeholders, different stakeholders have different levels of influence on the physical system to be defined. The most influence coming from those closest to the center."
[pcb.its.dot.gov/ standardstraining/ mod04/ ppt/ m04ppt.htm]
The onion diagram example "System stakeholders diagram" was drawn using the ConceptDraw PRO software extended with the Stakeholder Onion Diagrams solution from the Management area of ConceptDraw Solution Park.
Onion diagram example
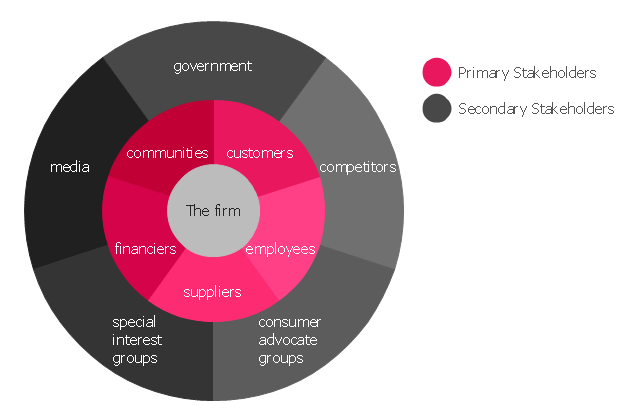
This onion diagram example was designed on the base of figure "Stakeholder Theory Diagram – Firm Centric. Based on R. Edward Freeman" in the article "Stakeholder Theory Diagram … like a donut" from the website "The Society Pages". [thesocietypages.org/ graphicsociology/ 2015/ 02/ 12/ stakeholder-theory-diagram/ ]
"The stakeholder theory is a theory of organizational management and business ethics that addresses morals and values in managing an organization. It was originally detailed by R. Edward Freeman in the book Strategic Management: A Stakeholder Approach identifies and models the groups which are stakeholders of a corporation, and both describes and recommends methods by which management can give due regard to the interests of those groups." [Stakeholder theory. Wikipedia]
This file is licensed under the Creative Commons Attribution Non-Commercial Share Alike license. [creativecommons.org/ licenses/ by-nc-sa/ 3.0/ us/ ]
The onion diagram example "Firm centric stakeholder diagram" was drawn using the ConceptDraw PRO software extended with the Stakeholder Onion Diagrams solution from the Management area of ConceptDraw Solution Park.
Onion diagram
Onion Diagram Templates

Design of Onion Diagrams and Stakeholder Onions Diagrams is a complex process, but ConceptDraw DIAGRAM diagramming and vector drawing software makes it easier thanks to the Stakeholder Onion Diagrams Solution from the Management Area of ConceptDraw Solution Park, and the set of included libraries and Onion Diagram templates.
Stakeholder Management System

ConceptDraw DIAGRAM is a powerful diagramming and vector drawing software. Now, thanks to the Stakeholder Onion Diagrams Solution included to the Management Area of ConceptDraw Solution Park, ConceptDraw DIAGRAM became also unique stakeholder management system design software.
Onion Diagram Process Design

ConceptDraw DIAGRAM diagramming and vector drawing software supplied with Stakeholder Onion Diagrams Solution from the Management Area of ConceptDraw Solution Park is an ideal software for effective Onion diagram process design.
UML Class Diagram Example for Transport System

This sample shows the transport protocol mappings for SNMP (Simple Network Management Protocol), the classes of the transport system and relationships between them and is used in IP network.
Onion Diagram Maker

ConceptDraw DIAGRAM diagramming and vector drawing software extended with Stakeholder Onion Diagrams Solution from the Management Area of ConceptDraw Solution Park is a professional Onion Diagram Maker.
UML Class Diagram Example for GoodsTransportation System

This sample shows the concept of working of the transport company and is used by transport companies, carriers at the transportation of various goods.
Circle Spoke Diagram Template

Data Flow Diagrams

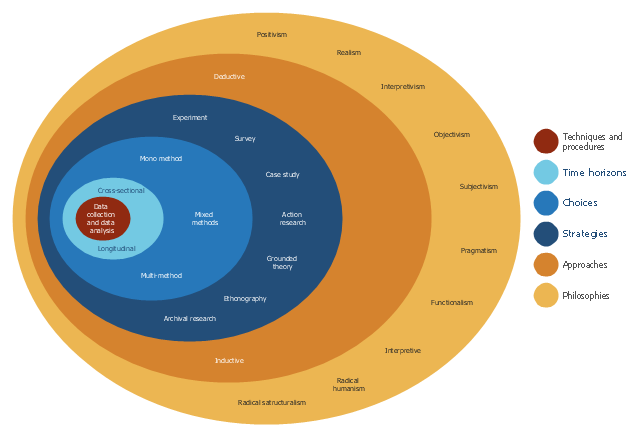
This onion diagram example was designed on the base of figure "Research onion" in the article "The research methodology for the development of a kaizen costing framework suitable for indigenous construction firms in Lagos, Nigeria." by T. Omotayo and U. Kulatunga from the Association of Researchers in Construction Management (ARCOM) website.
"The need for a cost management paradigm shift in the construction industry is imperative because of the prevailing challenges of managing construction cost during construction. Small and medium scale construction firms in Nigeria are faced with the challenges of competition from foreign firm, cost overrun, project delays and unsatisfied clients. This challenge may be handled with kaizen principles and kaizen costing. This paper utilized literatures related to research methodology in the built environment to create a research framework for the study. This focused on the research philosophical stands, approaches and strategy related to the built environment. The research onion model was adopted for the framework development and the sample size of two hundred and fifty (250) respondents was selected based on theoretical sampling for quantitative data collection using questionnaires." [arcom.ac.uk/ -docs/ workshops/ 2015-04_ Dublin-Proceedings.pdf]
The onion diagram example "Research onion diagram" was drawn using the ConceptDraw PRO software extended with the Stakeholder Onion Diagrams solution from the Management area of ConceptDraw Solution Park.
Onion diagram example
Flow Chart Diagram Examples

The Flowcharts Solution for ConceptDraw DIAGRAM is a comprehensive set of examples and samples in several different color themes for professionals that need to graphically represent a process.
State Diagram Example — Online Store

This sample shows the work of the online store and can be used for the understanding of the online shopping processes, for projection and creating of the online store.
Chart Templates

- Stakeholder diagram | Stakeholder Onion Diagrams | Stakeholder ...
- How To Create Onion Diagram | Onion Diagram Process Design ...
- Stakeholder Onion Diagrams | Network Diagram Examples | How to ...
- Network Diagram Examples | Stakeholder Onion Diagrams | Cisco ...
- State Diagram Example — Online Store | Stakeholder Management ...
- Context Diagram Template | Stakeholder Onion Diagram Template ...
- Stakeholder Mapping Tool | Circle Spoke Diagram Template ...
- Elliptical onion diagram - Template | Design elements - Stakeholder ...
- Venn Diagram Examples for Problem Solving. Environmental Social ...
- Research onion diagram | Stakeholder Onion Diagrams | Research ...
- Research onion diagram | Stakeholder diagram | Onion Diagram ...
- System stakeholders diagram | Stakeholder Onion Diagrams | How ...
- Stakeholder Onion Diagrams | How to Create a Stakeholder Onion ...
- Research onion diagram | Stakeholder Onion Diagrams | How To ...
- Firm centric stakeholder diagram | Stakeholder Onion Diagrams ...
- Stakeholder Management System | Flow chart Example . Warehouse ...
- Stakeholder diagram
- Management Stakeholder Onion Diagrams
- Stakeholder Onion Diagrams | Research onion diagram | ATM UML ...
- Stakeholder Management System | UML Class Diagram ...
- ERD | Entity Relationship Diagrams, ERD Software for Mac and Win
- Flowchart | Basic Flowchart Symbols and Meaning
- Flowchart | Flowchart Design - Symbols, Shapes, Stencils and Icons
- Flowchart | Flow Chart Symbols
- Electrical | Electrical Drawing - Wiring and Circuits Schematics
- Flowchart | Common Flowchart Symbols
- Flowchart | Common Flowchart Symbols