Stakeholder Mapping Tool

ConceptDraw DIAGRAM diagramming and vector drawing software extended with Stakeholder Onion Diagrams Solution from the Management Area of ConceptDraw Solution Park is a powerful stakeholder mapping tool which allows easy create Stakeholder Onion diagrams and maps depicting the layers of a project, relationships of stakeholders to a project goal, and relationships between stakeholders.
Circle Spoke Diagram Template

Stakeholder Onion Diagram Template

How To Create Onion Diagram

But how to create Onion Diagram? Now, it's very easy thanks to the ConceptDraw DIAGRAM diagramming and vector drawing software extended with Stakeholder Onion Diagrams Solution from the Management Area of ConceptDraw Solution Park.
Multi Layer Venn Diagram. Venn Diagram Example

Onion Diagram Templates

Design of Onion Diagrams and Stakeholder Onions Diagrams is a complex process, but ConceptDraw DIAGRAM diagramming and vector drawing software makes it easier thanks to the Stakeholder Onion Diagrams Solution from the Management Area of ConceptDraw Solution Park, and the set of included libraries and Onion Diagram templates.
 Stakeholder Onion Diagrams
The Stakeholder Onion Diagram is often used as a way to view the relationships of stakeholders to a project goal. A basic Onion Diagram contains a rich information. It shows significance of stakeholders that will have has influence to the success achieve
Stakeholder Onion Diagrams

Design fast and easy Stakeholder Onion Diagrams of any complexity in ConceptDraw DIAGRAM diagramming and vector drawing software using the powerful tools of Stakeholder Onion Diagrams Solution from the Management Area of ConceptDraw Solution Park.
Onion Diagram Process Design

ConceptDraw DIAGRAM diagramming and vector drawing software supplied with Stakeholder Onion Diagrams Solution from the Management Area of ConceptDraw Solution Park is an ideal software for effective Onion diagram process design.
Use this onion diagram template with ConceptDraw PRO software to design your stakeholder diagrams.
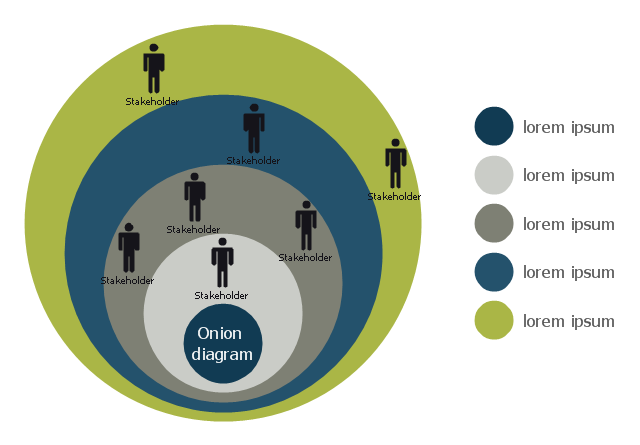
"The Onion Diagram is able to show layers of a complete system in a few circles. Each of the circles is able to represent a component that is dependent upon the component on the inside of it shown by the circle inside of it. The main concept of the diagram is shown by the center circle of the diagram. This chart is used due to the fact that it has a clear visual representation that is easy to read, and it has a strong visual impact." [Onion diagram. Wikipedia]
The stakeholder diagram template "Round onion diagram" is included in the Stakeholder Onion Diagrams solution from the Management area of ConceptDraw Solution Park.
Stakeholder diagram
- Stakeholder Circle Template
- Stakeholder Mapping Tool | Circle Spoke Diagram Template ...
- Stakeholder Circle Chart
- Circle Spoke Diagram Template | Circular diagrams - Vector stencils ...
- Fishbone Diagram Template | Circle Spoke Diagram Template ...
- Venn Diagram | Venn Diagrams | Stakeholder Onion Diagram ...
- Research cycle - Circle diagram | Workflow diagram - Template ...
- Circle Spoke Diagram Template | Stakeholder Onion Diagram ...
- Venn Diagram | Stakeholder Onion Diagram Template | Euler ...
- Venn Diagram | Stakeholder Onion Diagram Template | Venn ...
- ERD | Entity Relationship Diagrams, ERD Software for Mac and Win
- Flowchart | Basic Flowchart Symbols and Meaning
- Flowchart | Flowchart Design - Symbols, Shapes, Stencils and Icons
- Flowchart | Flow Chart Symbols
- Electrical | Electrical Drawing - Wiring and Circuits Schematics
- Flowchart | Common Flowchart Symbols
- Flowchart | Common Flowchart Symbols