Use this vertical bar chart template to design your column charts in the ConceptDraw PRO diagramming and vector drawing software.
"Bar graphs can ... be used for more complex comparisons of data with grouped bar charts and stacked bar charts. In a grouped bar chart, for each categorical group there are two or more bars. These bars are color-coded to represent a particular grouping. For example, a business owner with two stores might make a grouped bar chart with different colored bars to represent each store: the horizontal axis would show the months of the year and the vertical axis would show the revenue. Alternatively, a stacked bar chart could be used. The stacked bar chart stacks bars that represent different groups on top of each other. The height of the resulting bar shows the combined result of the groups. However, stacked bar charts are not suited to datasets where some groups have negative values. In such cases, grouped bar charts are preferable." [Bar chart. Wikipedia]
The column chart template "Double bar graph" is included in the Basic Bar Graphs solution from the Graphs and Charts area of ConceptDraw Solution Park.
Template

Bar Graph

The vector stencils library Bar charts contains templates you can simply drag from the library to your document in the the ConceptDraw PRO diagramming and vector drawing software, and add your data.
"A bar chart or bar graph is a chart with rectangular bars with lengths proportional to the values that they represent. The bars can be plotted vertically or horizontally. A vertical bar chart is sometimes called a column bar chart. ...
A bar graph is a chart that uses either horizontal or vertical bars to show comparisons among categories. One axis of the chart shows the specific categories being compared, and the other axis represents a discrete value. Some bar graphs present bars clustered in groups of more than one (grouped bar graphs), and others show the bars divided into subparts to show cumulate effect (stacked bar graphs)." [Bar chart. Wikipedia]
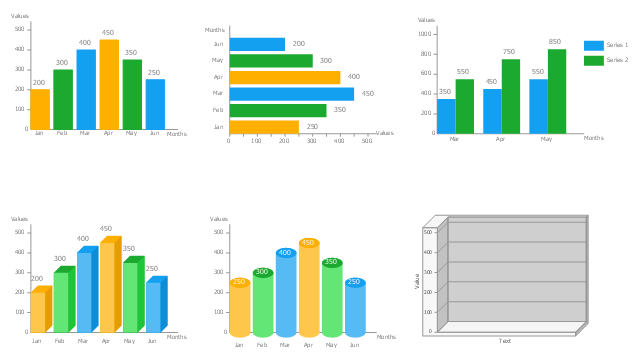
The graph template set "Design elements - Bar charts" is included the Basic Bar Graphs solution from the Graphs and Charts area of ConceptDraw Solution Park.
"A bar chart or bar graph is a chart with rectangular bars with lengths proportional to the values that they represent. The bars can be plotted vertically or horizontally. A vertical bar chart is sometimes called a column bar chart. ...
A bar graph is a chart that uses either horizontal or vertical bars to show comparisons among categories. One axis of the chart shows the specific categories being compared, and the other axis represents a discrete value. Some bar graphs present bars clustered in groups of more than one (grouped bar graphs), and others show the bars divided into subparts to show cumulate effect (stacked bar graphs)." [Bar chart. Wikipedia]
The graph template set "Design elements - Bar charts" is included the Basic Bar Graphs solution from the Graphs and Charts area of ConceptDraw Solution Park.
Bar graph templates
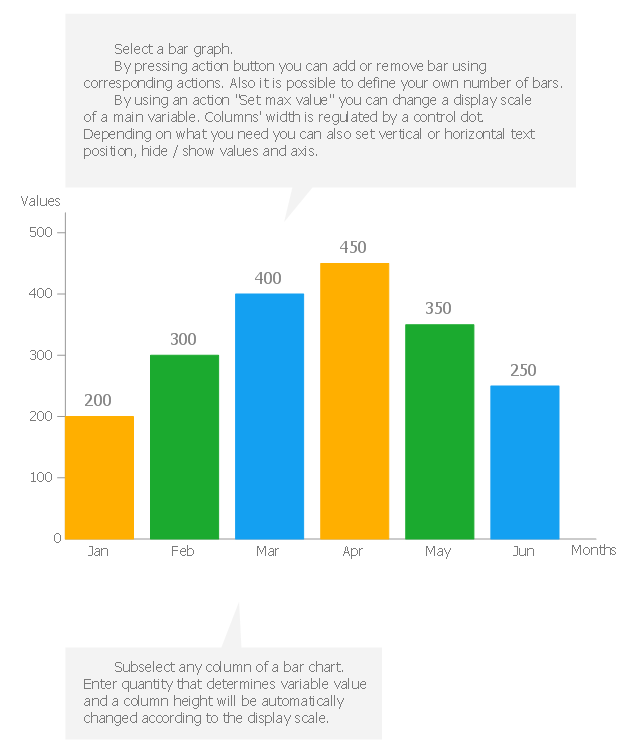
Use this column chart template to design your vertical bar graphs in the ConceptDraw PRO diagramming and vector drawing software.
"Bar charts have a discrete range. Bar charts are usually scaled so all the data can fit on the chart. Bars on the chart may be arranged in any order. Bar charts arranged from highest to lowest incidence are called Pareto charts. Normally, bars showing frequency will be arranged in chronological (time) sequence. Grouped bar graph usually present the information in the same order in each grouping. Stacked bar graphs present the information in the same sequence on each bar.
Bar charts provide a visual presentation of categorical data. Categorical data is a grouping of data into discrete groups, such as months of the year, age group, shoe sizes, and animals. These categories are usually qualitative. In a column bar chart, the categories appear along the horizontal axis; the height of the bar corresponds to the value of each category." [Bar chart. Wikipedia]
The bar graph template "Bar chart" is included in the Basic Bar Graphs solution from the Graphs and Charts area of ConceptDraw Solution Park.
Template
Stacked Graph

 Divided Bar Diagrams
The Divided Bar Diagrams Solution extends the capabilities of ConceptDraw PRO v10 with templates, samples, and a library of vector stencils for drawing high impact and professional Divided Bar Diagrams and Graphs, Bar Diagram Math, and Stacked Graph.
 Composition Dashboard
Composition dashboard solution extends ConceptDraw PRO software with templates, samples and vector stencils library with charts and indicators for drawing visual dashboards showing data composition.
 Education Package
Education Package is a comprehensive set of multifarious graphical solutions from ConceptDraw Solution Park, collected together in help to ConceptDraw PRO users working in a field of science, education and training, which is aimed at improving the quality of education and helping to design with ease variety of interesting and colorful educational materials, diagrams, charts and maps. Use it to present the information and knowledge in an interesting, clear, structured and simple form to achieve a success in education and pedagogy, to maintain the interest of students and pupils throughout the whole learning process, at the lectures, lessons and even during independent work with additional materials, to contribute to better perception of scientific information by listeners during the conferences and reports.
Flowchart Software

The Flowcharts diagrams are widely used for designing, documenting, analyzing and managing the complex processes and programs in various fields such as business, engineering, architecture, science, manufacturing, administration, etc.
 Plumbing and Piping Plans
Plumbing and Piping Plans solution extends ConceptDraw PRO v10.2.2 software with samples, templates and libraries of pipes, plumbing, and valves design elements for developing of water and plumbing systems, and for drawing Plumbing plan, Piping plan, PVC Pipe plan, PVC Pipe furniture plan, Plumbing layout plan, Plumbing floor plan, Half pipe plans, Pipe bender plans.
 Basketball
The Basketball Solution extends ConceptDraw PRO v9.5 (or later) software with samples, templates, and libraries of vector objects for drawing basketball diagrams, plays schemas, and illustrations. It can be used to make professional looking documents, pre
 Cloud Computing Diagrams
The Cloud Computing Diagrams solution extends the functionality of the ConceptDraw PRO software with comprehensive collection of libraries of cloud computing vector stencils to help you get started design of Cloud Computing Diagrams and Architecture D
 Rack Diagrams
Rack Diagrams solution extends ConceptDraw PRO software with samples, templates and libraries of vector stencils for drawing the computer network server rack mounting diagrams.
 Meter Dashboard
Meter dashboard solution extends ConceptDraw PRO software with templates, samples and vector stencils library with meter indicators for drawing visual dashboards showing quantitative data.
 Mechanical Engineering
This solution extends ConceptDraw PRO v.9 mechanical drawing software (or later) with samples of mechanical drawing symbols, templates and libraries of design elements, for help when drafting mechanical engineering drawings, or parts, assembly, pneumatic,
- How To Make A Stacked Bar Graph
- Bar Graphs | Sales Growth. Bar Graphs Example | Bar Diagrams for ...
- Bar Graph
- Bar Graphs | Sales Growth. Bar Graphs Example | Bar Graph | Why ...
- Bar Graphs
- Bar Graph Generator
- Green Bar Graph
- Double bar graph - Template | Bar Chart Examples | Column Chart ...
- Bar Graph | Bar Chart Software | Double bar graph - Template ...
- Serious crime in Cincinnati | Chart Maker for Presentations | Column ...
- Grouped Bar Charts
- Bar Chart Template for Word | Double bar graph - Template | Chart ...
- Bar Graphs | Bar Graph | Double bar graph - Template | _bar Graph_
- Double bar graph - Template | Bar Chart Template for Word | Chart ...
- Double bar graph - Template | Column Chart Template | Bar chart ...
- Double bar graph - Template | Double bar chart - Nitrate ...
- Sales Growth. Bar Graphs Example | Double bar graph - Template ...
- Bar Diagram Math | Divided Bar Diagrams | Double bar graph ...
- Column Chart Template
- Bar Chart Examples | Chart Maker for Presentations | Bar Chart ...
- ERD | Entity Relationship Diagrams, ERD Software for Mac and Win
- Flowchart | Basic Flowchart Symbols and Meaning
- Flowchart | Flowchart Design - Symbols, Shapes, Stencils and Icons
- Flowchart | Flow Chart Symbols
- Electrical | Electrical Drawing - Wiring and Circuits Schematics
- Flowchart | Common Flowchart Symbols
- Flowchart | Common Flowchart Symbols