Spider Chart Template


Chart Maker for Presentations

Radar Chart

Rainfall Bar Chart

This sample was created in ConceptDraw DIAGRAM diagramming and vector drawing software using the Bar Graphs Solution from the Graphs and Charts area of ConceptDraw Solution Park.
Circle Spoke Diagram Template

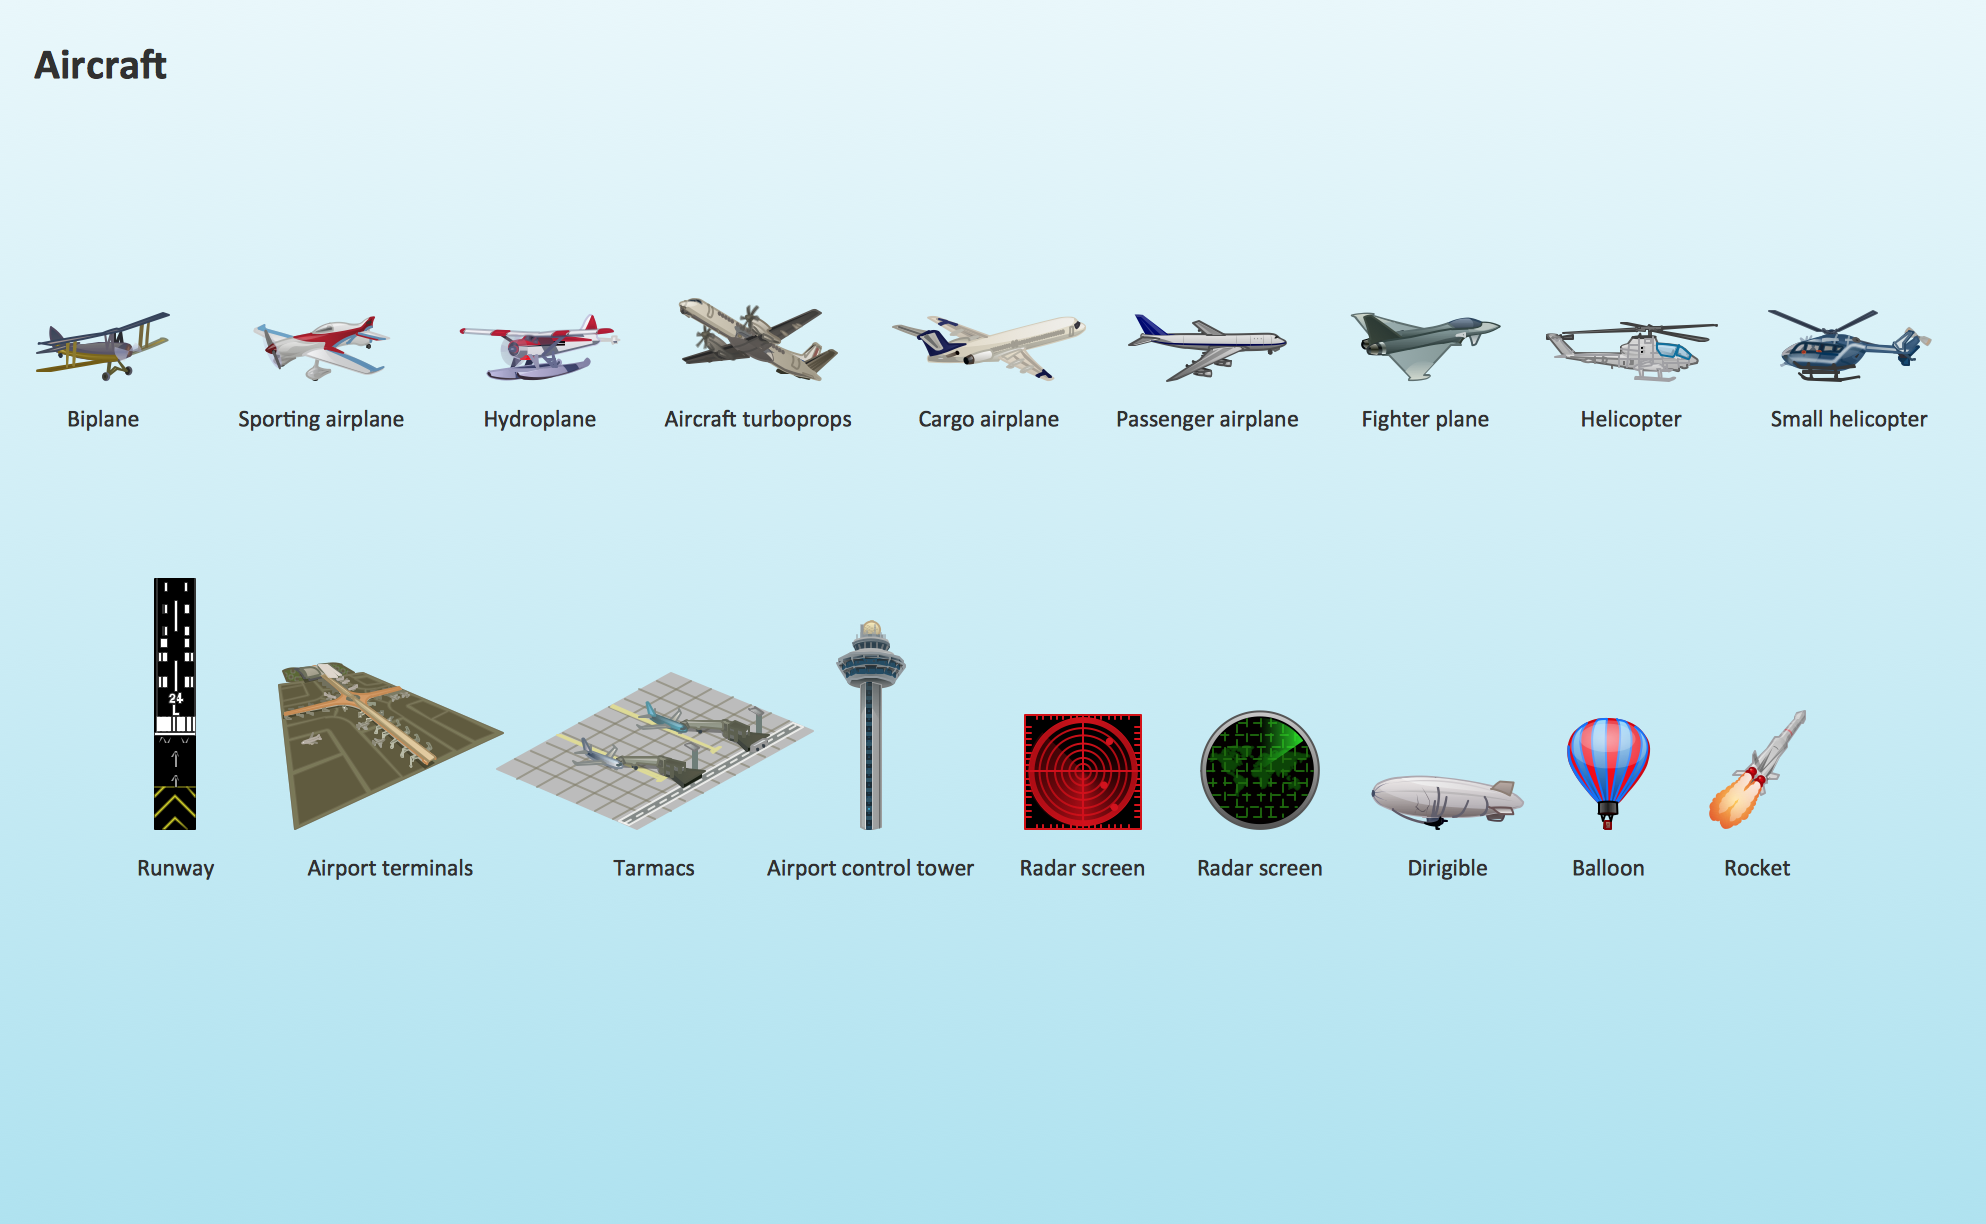
Aircraft - Design Elements
Sales Growth. Bar Graphs Example

Hiring Process

ConceptDraw DIAGRAM diagramming and vector drawing software aspires to help its users in the hiring process and offers a powerful HR Flowcharts Solution from the Management Area of ConceptDraw Solution Park.
Column Chart Software

Pie Chart Examples and Templates

Pie chart examples and templates created using ConceptDraw DIAGRAM software helps you get closer with pie charts and find pie chart examples suite your needs.
Chart Software for Better Presentations

Graphs and Charts Area provide a wide collection of professional looking predesigned templates, samples and ready-to-use vector stencils that will help you to draw the charts and diagrams of various types: Pie Charts, Donut Charts, Line Charts, Column Charts, Bar Charts, Pyramids, Scatter Charts, Venn Diagrams, Spider Charts, Area Charts, Divided Bar Graphs.
Bar Charts

The vector stencils library "Concept maps" contains 16 geometrical shapes.
Use it to create your concept maps, mindmaps, idea maps, tree diagrams, omega maps, cluster diagrams and spider diagrams.
The symbols example "Concept maps - Vector stencils library" was created using the ConceptDraw PRO diagramming and vector drawing software extended with the Concept Maps solution from the area "What is a Diagram" of ConceptDraw Solution Park.
Rectangle

Rounded rectangle

Stadium
Oval
Diamond

Parallelogram

Circle

Star

Hexagon

Cloud

Starburst

Arrow
Envelope

Note

Callout

Table
Flowchart Software

ConceptDraw DIAGRAM flowchart software will help to quickly create new flowcharts, workflow, NS Diagram, BPMN Diagram, Cross-functional flowcharts, data flow diagrams and highlight flowcharts.
Feature-rich flowchart maker, free thousand flowchart examples and templates and colored symbols that will allow you to create professional looking flowcharts simply.
ConceptDraw DIAGRAM supports macOS and Windows.

- Spider Diagram Examples
- Hiring Process | Pie Chart Examples and Templates | Spider ...
- Spider Diagram Free Templates And Examples Download
- Spider Chart Template | Chart Maker for Presentations | Percentage ...
- Percentage Spider Diagram Example
- Spider Chart Template | Radar Chart | Rainfall Bar Chart | Spider ...
- Spider Chart Template | Diagrams Mean Nothing | Chart Maker for ...
- Pie Chart Word Template. Pie Chart Examples | Spider Chart ...
- Spider Chart Template | Radar Chart | Chart Maker for Presentations ...
- Percentage Spider Chart | Spider Chart Template | Circle Spoke ...
- Percentage Spider Chart | Chart Maker for Presentations | Audit ...
- Spider Chart Template | Chart Maker for Presentations | Radar Chart ...
- Chart Maker for Presentations | Percentage Spider Chart | Radar ...
- Spider Chart Template | Flowchart Software | Blank Scatter Plot ...
- Spider Chart Template | Percentage Spider Chart | Radar Chart ...
- Flowchart Software | Radar Chart | Blank Scatter Plot | Blank Spider ...
- Spider Chart Template | Radar Chart | MS Visio Look a Like ...
- Pie Chart Examples and Templates | Percentage Spider Chart ...
- Radar Chart | Spider Chart Template | Audit Flowcharts | Spider ...
- UML Diagram Visio | Spider Diagram Of Environment
- ERD | Entity Relationship Diagrams, ERD Software for Mac and Win
- Flowchart | Basic Flowchart Symbols and Meaning
- Flowchart | Flowchart Design - Symbols, Shapes, Stencils and Icons
- Flowchart | Flow Chart Symbols
- Electrical | Electrical Drawing - Wiring and Circuits Schematics
- Flowchart | Common Flowchart Symbols
- Flowchart | Common Flowchart Symbols