TQM Diagram Tool

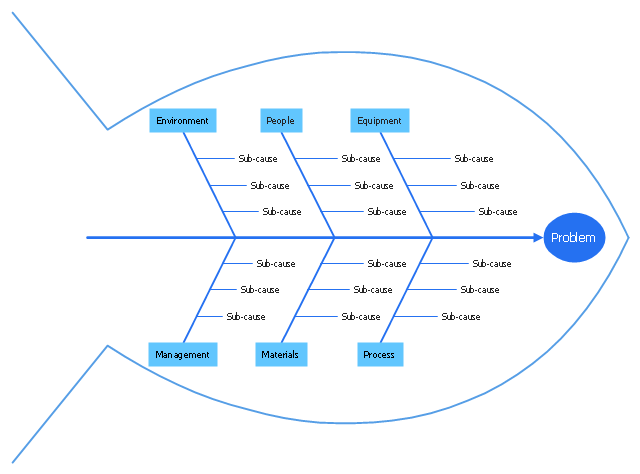
"Ishikawa diagrams (also called fishbone diagrams, herringbone diagrams, cause-and-effect diagrams, or Fishikawa) are causal diagrams created by Kaoru Ishikawa (1968) that show the causes of a specific event. Common uses of the Ishikawa diagram are product design and quality defect prevention, to identify potential factors causing an overall effect. Each cause or reason for imperfection is a source of variation. Causes are usually grouped into major categories to identify these sources of variation. The categories typically include:
- People: Anyone involved with the process
- Methods: How the process is performed and the specific requirements for doing it, such as policies, procedures, rules, regulations and laws
- Machines: Any equipment, computers, tools, etc. required to accomplish the job
- Materials: Raw materials, parts, pens, paper, etc. used to produce the final product
- Measurements: Data generated from the process that are used to evaluate its quality
- Environment: The conditions, such as location, time, temperature, and culture in which the process operates" [Ishikawa diagram. Wikipedia]
The fishbone diagram example "Causes of low-quality output" was created using the ConceptDraw PRO diagramming and vector drawing software extended with the Fishbone Diagrams solution from the Management area of ConceptDraw Solution Park.
Ishikawa diagram

"Common uses of the Ishikawa diagram are product design and quality defect prevention, to identify potential factors causing an overall effect. Each cause or reason for imperfection is a source of variation. Causes are usually grouped into major categories to identify these sources of variation. The categories typically include:
(1) People: Anyone involved with the process;
(2) Methods: How the process is performed and the specific requirements for doing it, such as policies, procedures, rules, regulations and laws;
(3) Machines: Any equipment, computers, tools, etc. required to accomplish the job;
(4) Materials: Raw materials, parts, pens, paper, etc. used to produce the final product;
(5) Measurements: Data generated from the process that are used to evaluate its quality;
(6) Environment: The conditions, such as location, time, temperature, and culture in which the process operates. ...
Ishikawa diagrams were popularized by Kaoru Ishikawa in the 1960s, who pioneered quality management processes in the Kawasaki shipyards, and in the process became one of the founding fathers of modern management.
The basic concept was first used in the 1920s, and is considered one of the seven basic tools of quality control." [Ishikawa diagram. Wikipedia]
This quality Ishikawa diagram (cause and effect diagram) template is included in the Fishbone Diagram solution from the Management area of ConceptDraw Solution Park.
Quality fishbone diagram
Cause and Effect Diagrams

ConceptDraw PRO powerful diagramming and vector drawing software provides the Fishbone Diagrams solution from the Management area of ConceptDraw Solution Park that allows to design the Cause and Effect Diagrams quick, easy and effective.
The vector stencils library "Cause-and-effect diagram" contains 13 elements of fishbone diagram.
Use it to design your Ishikawa diagrams with ConceptDraw PRO diagramming and vector drawing software.
"Ishikawa diagrams (also called fishbone diagrams, herringbone diagrams, cause-and-effect diagrams, or Fishikawa) are causal diagrams created by Kaoru Ishikawa (1968) that show the causes of a specific event. Common uses of the Ishikawa diagram are product design and quality defect prevention to identify potential factors causing an overall effect. Each cause or reason for imperfection is a source of variation. Causes are usually grouped into major categories to identify these sources of variation. ...
The basic concept was first used in the 1920s, and is considered one of the seven basic tools of quality control." [Ishikawa diagram. Wikipedia]
The example of fishbone diagram shapes "Design elements - Cause-and-effect diagram" is included in the Seven Basic Tools of Quality solution from the Quality area of ConceptDraw Solution Park.
Fishbone diagram elements

Cause and Effect Diagram

Cause and Effect Fishbone Diagram

Now the problem of complexity the Cause and Effect Fishbone Diagram creating is solved thanks to the ConceptDraw PRO diagramming and vector drawing software extended with Fishbone Diagrams solution from the Management area.
Cause and Effect Analysis

Cause and Effect Analysis - Fishbone Diagrams for Problem Solving

Create Fishbone Diagrams with the ConceptDraw

Use a Fishbone Diagram to Attack Complex Problems

Use ConceptDraw PRO diagramming software with Fishbone Diagrams Solution to attack any complex problems with fishbone diagrams graphic method. Construct Fishbone diagram to help users brainstorm and break down a complex problem.
Total Quality Management Value

Fishbone Diagram

ConceptDraw PRO supplied with Fishbone Diagrams solution from the Management area is the best software for fast and easy drawing professional looking Fishbone Diagram.
Cause and Effect Diagram Software

You can design your Cause and Effect diagram on a paper, but more effective way is to use specific software - ConceptDraw PRO is a powerful Cause and Effect Diagram Software. It helps you create Cause and Effect diagram known also as Fishbone diagram or Ishikawa diagram from templates and examples.
- Fishbone Diagram | Total Quality Management Value | Seven Basic ...
- Design elements - Cause -and-effect diagram | Fishbone diagram ...
- Fish Bone Causes Of Good Quality Product
- Cause and Effect Analysis - Fishbone Diagrams for Problem Solving ...
- Quality fishbone diagram - Template | Ishikawa fishbone diagram ...
- Fishbone diagram - Causes of low- quality output | Total Quality ...
- Cause and Effect Analysis - Fishbone Diagrams for Problem Solving ...
- Total Quality Management with ConceptDraw | Design elements ...
- Process Flowchart | Fishbone diagram - Causes of low- quality ...
- Total Quality Management with ConceptDraw | TQM Diagram Tool ...
- Fishbone Diagram | Management | Fishbone diagram - Causes of ...
- How to Construct a Fishbone Diagram | Cause and Effect Diagrams ...
- Total Quality Management Value | TQM Diagram Tool | Seven Basic ...
- Fishbone Diagram | Seven Basic Tools of Quality - Fishbone ...
- Total Quality Management with ConceptDraw | Total Quality ...
- Total Quality Management Value | Fishbone diagram - Causes of ...
- Quality fishbone diagram - Template | TQM Diagram Tool | Total ...
- Service 8 Ps fishbone diagram - Template | Management | Quality ...
- TQM Diagram Tool | Total Quality Management Value | Fishbone ...
- PROBLEM ANALYSIS. Root Cause Analysis Tree Diagram | Cause ...
- ERD | Entity Relationship Diagrams, ERD Software for Mac and Win
- Flowchart | Basic Flowchart Symbols and Meaning
- Flowchart | Flowchart Design - Symbols, Shapes, Stencils and Icons
- Flowchart | Flow Chart Symbols
- Electrical | Electrical Drawing - Wiring and Circuits Schematics
- Flowchart | Common Flowchart Symbols
- Flowchart | Common Flowchart Symbols