Bubble diagrams in Landscape Design with ConceptDraw DIAGRAM
To define the links between the different areas of your own landscape design and see the project from aside, we recommend to draw landscape diagram called bubble one which is analogue of «mind maps» as it allows us to create approximate image of our future proper landscape view. Use special libraries (and we have plenty of them) with objects of landscape design to be able to create the detailed plan of your landscape which will be looking so smart and professionally good as the samples we provide were created by designers who know so much about making such kinds of design plans. Having ConceptDraw DIAGRAM as the assistant in your work, will ensure the success after using our product. Make the bubble diagrams as well as any other ones in minutes with ease having our application called ConceptDraw DIAGRAM and you will see how quick it will change your life simplifying lots of work.HelpDesk
How to Draw a Pie Chart
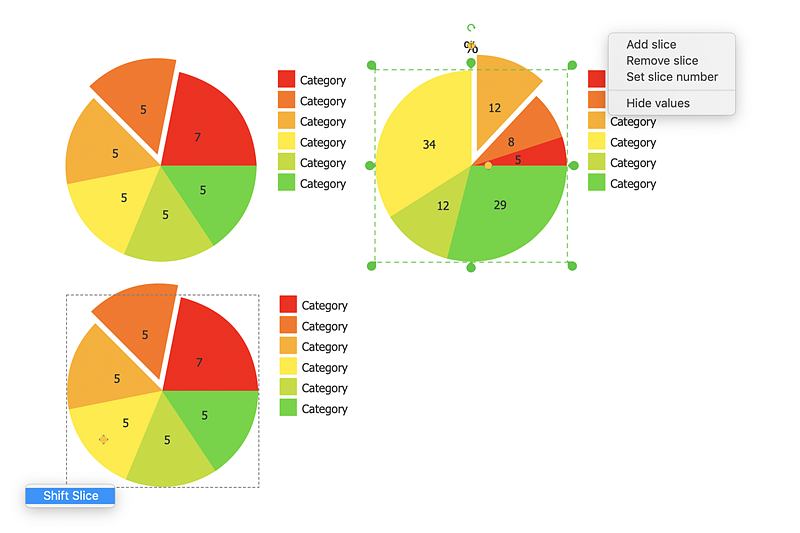
A pie chart represents data, in a clear and easy to read around (pie) form. A circular pie chart is divided into sections (slice). Each "slice" depicts the It reflects the proportion of each component in the whole "pie". This type of chart is most often used for the visualization of statistical data. That is why pie charts are widely used in marketing. As the pie charts show proportional parts of a whole, they are good for various visual comparisons. For example, it is difficult to imagine a more intuitive way to show segmentation and market share. ConceptDraw DIAGRAM allows you to draw a simple and clear Pie Chart using the Pie Charts solution.HelpDesk
How to Save a Drawing as a Graphic File
ConceptDraw DIAGRAM can save your drawings and diagrams in a number of highly useful formats, including graphic files. You can save your drawing as a.PNG,.JPG, or other graphic format file.HelpDesk
How To Create a PERT Chart Using PM Easy Solution
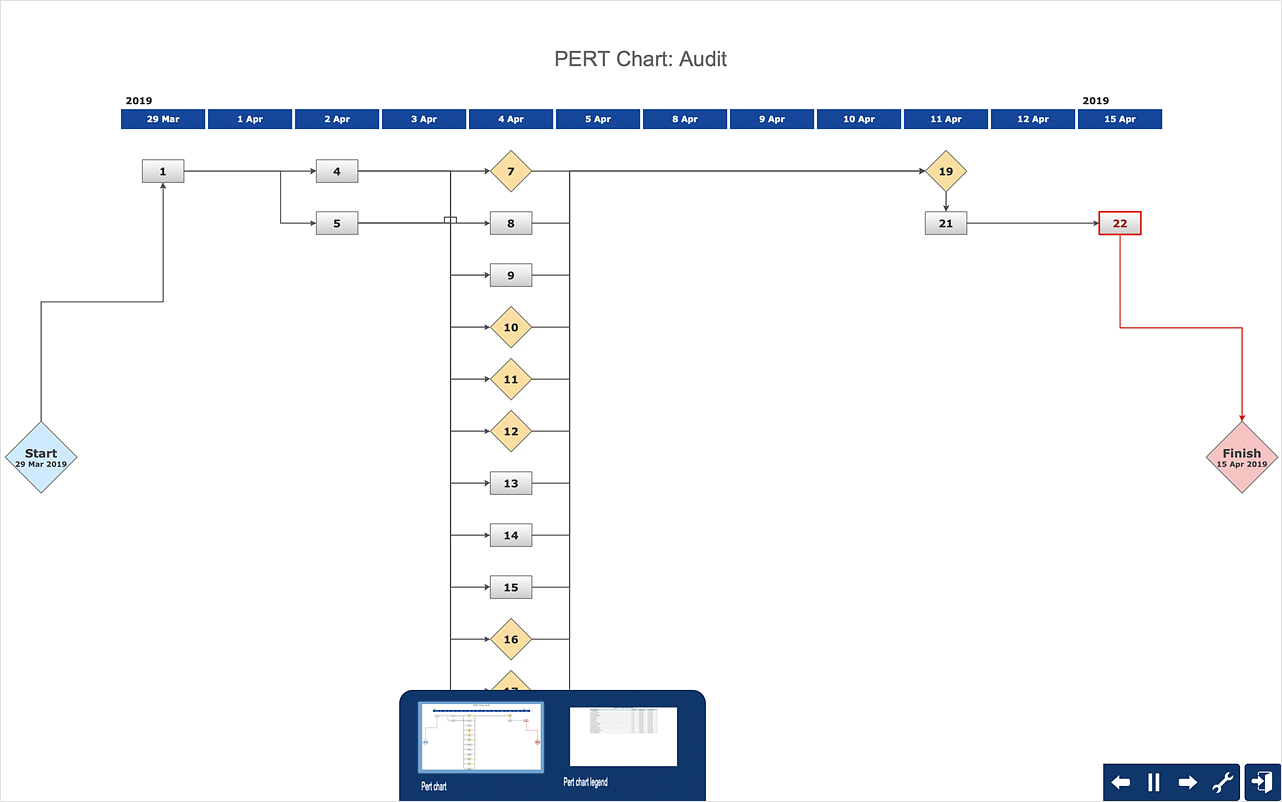
Project Evaluation and Review Technique (PERT) is a method of project tasks evaluation and analysis. PERT - is a method of analyzing the tasks required to complete the project. It includes analysis of the time required to complete each task, as well as the determination of the time required to carry out the whole project. PERT was developed to facilitate the planning of huge and complex projects. PERT is used for very large, complex, and non-standard projects. Technology implies the presence of uncertainty, making it possible to develop a schedule of the project without precise information on details and time required for all of its components. The most popular part of PERT is a method of the critical path, based on the construction of the network schedule (PERT network diagram). ConceptDraw Office delivers you the best way to create PERT chart for your project using compatibility between ConceptDraw PROJECT and ConceptDraw DIAGRAM.Software development with ConceptDraw DIAGRAM
ConceptDraw possesses powerful tools for designing of technical documentation for object-oriented projects. The libraries included in the package allow to easily draw class hierarchies, object hierarchies and diagrams of data flows with the use of the most popular notations, including UML and Booch notations.HelpDesk
How to Draw the Different Types of Pie Charts
Using a Pie Chart, you can visually estimate the relative contribution that different data categories contribute to a whole value. The pie chart displays the statistics in a visual format. The main use of pie charts to show comparisons. The larger piece of the pie, the more the value of this value compared to the rest. Various applications of pie charts can be found in business and education. For business, pie charts can be used to compare the success or failure of the goods or services. They may also be used to display the business market share.- Simple Whole Landscape Design
- How To use Landscape Design Software | Landscape Architecture ...
- Bubble diagrams in Landscape Design with ConceptDraw PRO ...
- Landscape Architecture with ConceptDraw PRO | How To use ...
- Landscape Design Drawing Free Download For Mac
- Landscape Architecture with ConceptDraw PRO | How To use ...
- How to Draw a Natural Landscape | How to Design a Good ...
- Landscape Design For Mac Free
- Free Landscape Design Software For Mac Download
- How To use Landscape Design Software | Bubble diagrams in ...
- How To use Landscape Design Software | Bubble diagrams in ...
- How To use Landscape Design Software | Building Drawing ...
- How To use Landscape Design Software | Landscape Architecture ...
- Landscape Architecture with ConceptDraw PRO | How To use ...
- Landscaping Design Software Free Download For Mac
- Landscape Design Mac Free Trial
- Landscape Design Software For Mac Free Trial
- How To use Landscape Design Software | Bubble diagrams in ...
- How To use Landscape Design Software | Landscape Architecture ...
- Landscape Design Mac
- ERD | Entity Relationship Diagrams, ERD Software for Mac and Win
- Flowchart | Basic Flowchart Symbols and Meaning
- Flowchart | Flowchart Design - Symbols, Shapes, Stencils and Icons
- Flowchart | Flow Chart Symbols
- Electrical | Electrical Drawing - Wiring and Circuits Schematics
- Flowchart | Common Flowchart Symbols
- Flowchart | Common Flowchart Symbols


