Venn Diagram

 Venn Diagrams
Venn Diagrams are actively used to illustrate simple set relationships in set theory and probability theory, logic and statistics, mathematics and computer science, linguistics, sociology, and marketing. Venn Diagrams are also often used to visually summarize the status and future viability of a project.
Simple Diagramming


Venn Diagram Examples for Problem Solving. Venn Diagram as a Truth Table

HelpDesk
How to Create a Venn Diagram in ConceptDraw PRO

Simple Flow Chart

Simple Drawing Applications for Mac

"A Venn diagram is constructed with a collection of simple closed curves drawn in a plane. According to Lewis, the "principle of these diagrams is that classes [or sets] be represented by regions in such relation to one another that all the possible logical relations of these classes can be indicated in the same diagram. That is, the diagram initially leaves room for any possible relation of the classes, and the actual or given relation, can then be specified by indicating that some particular region is null or is not-null".
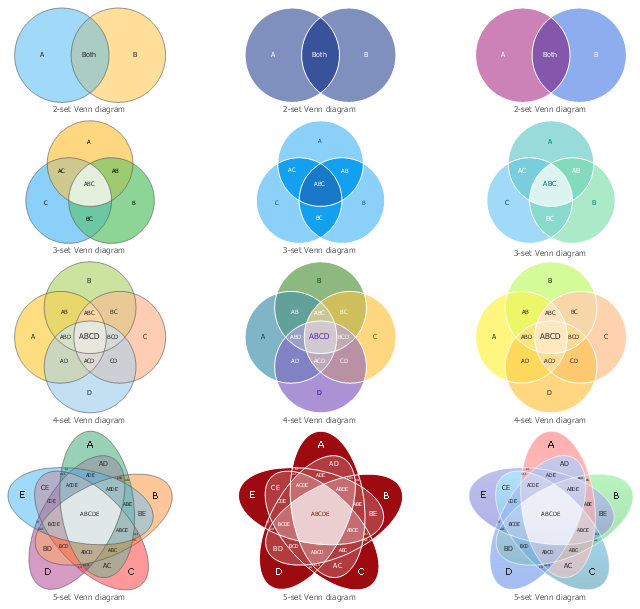
Venn diagrams normally comprise overlapping circles. The interior of the circle symbolically represents the elements of the set, while the exterior represents elements that are not members of the set. For instance, in a two-set Venn diagram, one circle may represent the group of all wooden objects, while another circle may represent the set of all tables. The overlapping area or intersection would then represent the set of all wooden tables. Shapes other than circles can be employed as shown below by Venn's own higher set diagrams. Venn diagrams do not generally contain information on the relative or absolute sizes (cardinality) of sets; i.e. they are schematic diagrams." [Venn diagram. Wikipedia]
The example "Design elements - Venn diagrams" was created using the ConceptDraw PRO diagramming and vector drawing software extended with the Venn Diagrams solution from the area "What is a Diagram" of ConceptDraw Solution Park.
Venn diagram templates
Mathematical Diagrams

Mathematics solution provides 3 libraries: Plane Geometry Library, Solid Geometry Library, Trigonometric Functions Library.
Basic Diagramming

Visual Presentations Made Easy with Diagramming Software

Venn Diagram Maker

Basic Diagramming


- Venn Diagrams | Simple Diagramming | Venn Diagram | Venn ...
- Basic Circles Venn Diagram . Venn Diagram Example | Venn ...
- Venn Diagram Template | Venn Diagram | Venn Diagrams ...
- Venn Diagram | Venn Diagram Template for Word | Basic Circles ...
- Basic Flowchart Symbols and Meaning | Simple Flow Chart | Venn ...
- Basic Diagramming | Venn Diagram Examples for Problem Solving ...
- ATM UML Diagrams | AWS Architecture Diagrams | Venn Diagrams ...
- Venn Diagram Examples for Problem Solving . Quantum Information ...
- Best Diagramming Software for Mac | Venn Diagram Examples for ...
- Process Flowchart | Simple Drawing Applications for Mac | Venn ...
- Simple Bar Chart Economic Analysis
- Basic Diagramming | Mathematics | The Best Choice for Creating ...
- Venn diagrams - Vector stencils library | 2-Set Venn diagram ...
- Basic Flowchart Symbols and Meaning | Venn Diagram Examples ...
- Venn Diagram Examples for Problem Solving. Venn Diagram as a ...
- Venn Diagram Examples for Problem Solving. Venn Diagram as a ...
- Different Designs Of Venn Diagram
- Venn Diagrams | Concept Maps | ConceptDraw Solution Park ...
- Sample Venn Diagram
- Basic Flowchart Symbols and Meaning | Flowcharts | Circles Venn ...
- ERD | Entity Relationship Diagrams, ERD Software for Mac and Win
- Flowchart | Basic Flowchart Symbols and Meaning
- Flowchart | Flowchart Design - Symbols, Shapes, Stencils and Icons
- Flowchart | Flow Chart Symbols
- Electrical | Electrical Drawing - Wiring and Circuits Schematics
- Flowchart | Common Flowchart Symbols
- Flowchart | Common Flowchart Symbols