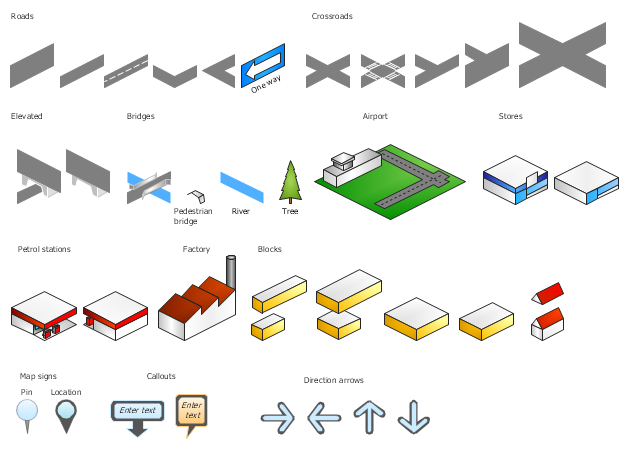
The vector stencils library "3D directional maps" contains 40 symbols for creating pictorial maps, street maps, locator maps, transit maps, tourist maps with points of interest (POI), road maps and route maps using the ConceptDraw PRO diagramming and vector drawing software.
"Pictorial maps are a category of maps that are also loosely called illustrated maps, panoramic maps, perspective maps, bird’s-eye view maps and Geopictorial maps amongst others. In contrast to the regular road map, Atlas or topographic cartography, pictorial maps depict a given territory with a more artistic rather than technical style. The cartography can be a sophisticated 3-D perspective landscape or a simple map graphic enlivened with illustrations of buildings, people and animals. They can feature all sorts of varied topics like historical events, legendary figures or local agricultural products and cover anything from an entire continent to a college campus. ...
Pictorial maps usually show an area as if viewed from above at an oblique angle. They are not generally drawn to scale in order to show street patterns, individual buildings, and major landscape features in perspective. While regular maps focus on the accurate rendition of distances, pictorial maps enhance landmarks and often incorporate a complex interplay of different scales into one image in order to give the viewer a more familiar sense of recognition." [Pictorial maps. Wikipedia]
The design elements library "3D directional maps" is included in the Directional Maps solution from the Maps area of ConceptDraw Solution Park.
3D pictorial map symbols
HelpDesk
How to Create a Directional Map Using ConceptDraw PRO

This SWOT matrix diagram example was created on the base of article "An Easy Way To Jumpstart Your Strategic Plan: SWOT" by Leslie Wolf from the website of the California Digital Library, the University of California. "Strategic planning doesn’t have to be a daunting and lengthy process. The goal is really a simple one: to help you understand your world and build a road map to guide your efforts. ...
This analysis tool can help you focus your attention on the specific success factors that are right for your team.
The tool is called a SWOT analysis. SWOT stands for Strengths and Weaknesses, Opportunities and Threats. Here’s what it means:
(1) Strengths are those positive internal attributes that strengthen your business or team. You can develop plans to capitalize on those strengths.
(2) Weaknesses are those negative internal attributes that are working against your success. You can shore up those weaknesses so they don’t stop your success.
(3) Opportunities are those external conditions that can have a positive effect on your goals. These opportunities can point you in the right direction.
(4) Threats are those external conditions that can have a negative effect on your goals. These threats will affect you less if you can identify and minimize them. ...
We thought it would be helpful to show you a sample SWOT analysis for a business you can easily visualize: a small independent bookstore in a university town. The store owner brought the team together to think about how the bookstore could survive during the continuing financial downturn. After an hour of brainstorming, this is the SWOT analysis they developed." [cdlib.org/ cdlinfo/ 2010/ 09/ 29/ an-easy-way-to-jumpstart-your-strategic-plan-swot/ ]
The matrix diagram example "SWOT analysis for a small independent bookstore" was created using the ConceptDraw PRO diagramming and vector drawing software extended with the SWOT Analysis solution from the Management area of ConceptDraw Solution Park.
SWOT matrix

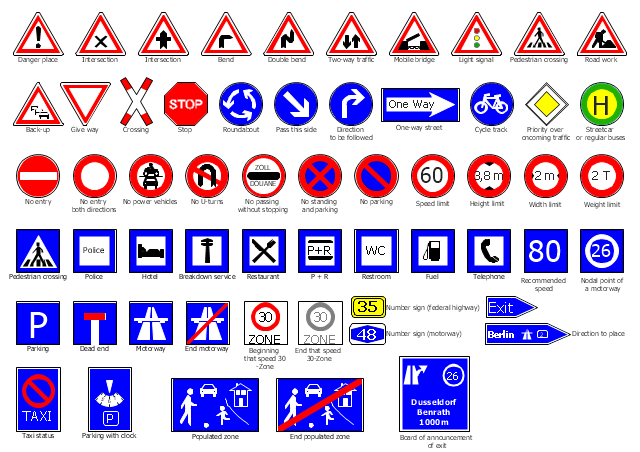
The vector stencils library "Road signs" contains 58 symbols of traffic signs for labeling the road and route maps, street and locator maps, transit and directional maps using the ConceptDraw PRO diagramming and vector drawing software.
"Traffic signs or road signs are signs erected at the side of or above roads to give instructions or provide information to road users. ...
With traffic volumes increasing since the 1930s, many countries have adopted pictorial signs or otherwise simplified and standardized their signs to overcome language barriers, and enhance traffic safety. Such pictorial signs use symbols (often silhouettes) in place of words and are usually based on international protocols. Such signs were first developed in Europe, and have been adopted by most countries to varying degrees." [Traffic sign. Wikipedia]
The vector stencils library "Road signs" is included in the Directional Maps solution from the Maps area of ConceptDraw Solution Park.
Road signs
Map Infographic Design

Excellent Examples of Infographic Maps

How tо Represent Information Graphically

Tools to Create Your Own Infographics

Spatial Infographics

Cross-Functional Flowchart

Use cross-functional flowcharts to show the relationship between a business process and the functional units (such as departments) responsible for that process. To create it use the best flowchart maker of ConceptDraw PRO.

How to Create a Powerful Infographic When You do not Have a Designer

Sign Making Software

Sign making software is very useful tool for professional sign-making business. Use ConceptDraw PRO and make sure that now sign making is easier and timesaving than ever!
Cross-Functional Flowchart (Swim Lanes)

Use flowchart maker of ConceptDraw PRO enhanced with solutions from ConceptDraw Solution Park to create diagrams to present and explain structures, process flows, logical relationships, networks, design schemes and other visually organized information and knowledge.
Building Drawing Software for Design Site Plan


Business diagrams & Org Charts with ConceptDraw PRO


- Drawing Simple Road Map Software
- Simple Way To Draw Road Map
- A Simple Pictorial Map
- Road Map
- Maps | Directional Maps | Map Directions | Road Maps
- 3D pictorial road map | 2D Directional map - Template | Directions ...
- Drawing Roads Map Soft
- Directions Map | 2D Directional map - Template | Directions Maps ...
- Software To Draw Plan And Road Map
- Roadmap For Drawing And Dirction
- Draw Simple Location Map
- 3D pictorial street map | How To Create Restaurant Floor Plan in ...
- Directional Maps | How to Create a Directional Map Using ...
- Simple Graphic Maps
- Maps and Directions | Map Directions | Directions Maps | Roads ...
- 2D Directional map - Template | 3D pictorial road map | 3D ...
- Maps and Directions
- Directional Maps | Design elements - 3D directional maps | 3D ...
- Directional Maps | 3D pictorial road map | Examples of Flowcharts ...
- 3D pictorial street map | Design elements - 3D directional maps ...
- ERD | Entity Relationship Diagrams, ERD Software for Mac and Win
- Flowchart | Basic Flowchart Symbols and Meaning
- Flowchart | Flowchart Design - Symbols, Shapes, Stencils and Icons
- Flowchart | Flow Chart Symbols
- Electrical | Electrical Drawing - Wiring and Circuits Schematics
- Flowchart | Common Flowchart Symbols
- Flowchart | Common Flowchart Symbols